
Image
For about a year now, the support team of one of our high-loaded instruments has been using an ML-system of our own development, the Problem Detection Platform (PDP). This service can analyze logs and automatically classify errors. As a result, the support team does not get a bunch of raw data from the logs, but rather information that can be handled quickly and conveniently.
Machine learning is a branch of artificial intelligence technologies that allow analytical systems to see patterns in raw data. It is used for recognizing objects in photos and videos, combating security threats and financial fraud, balancing traffic in telecommunications infrastructures, etc.
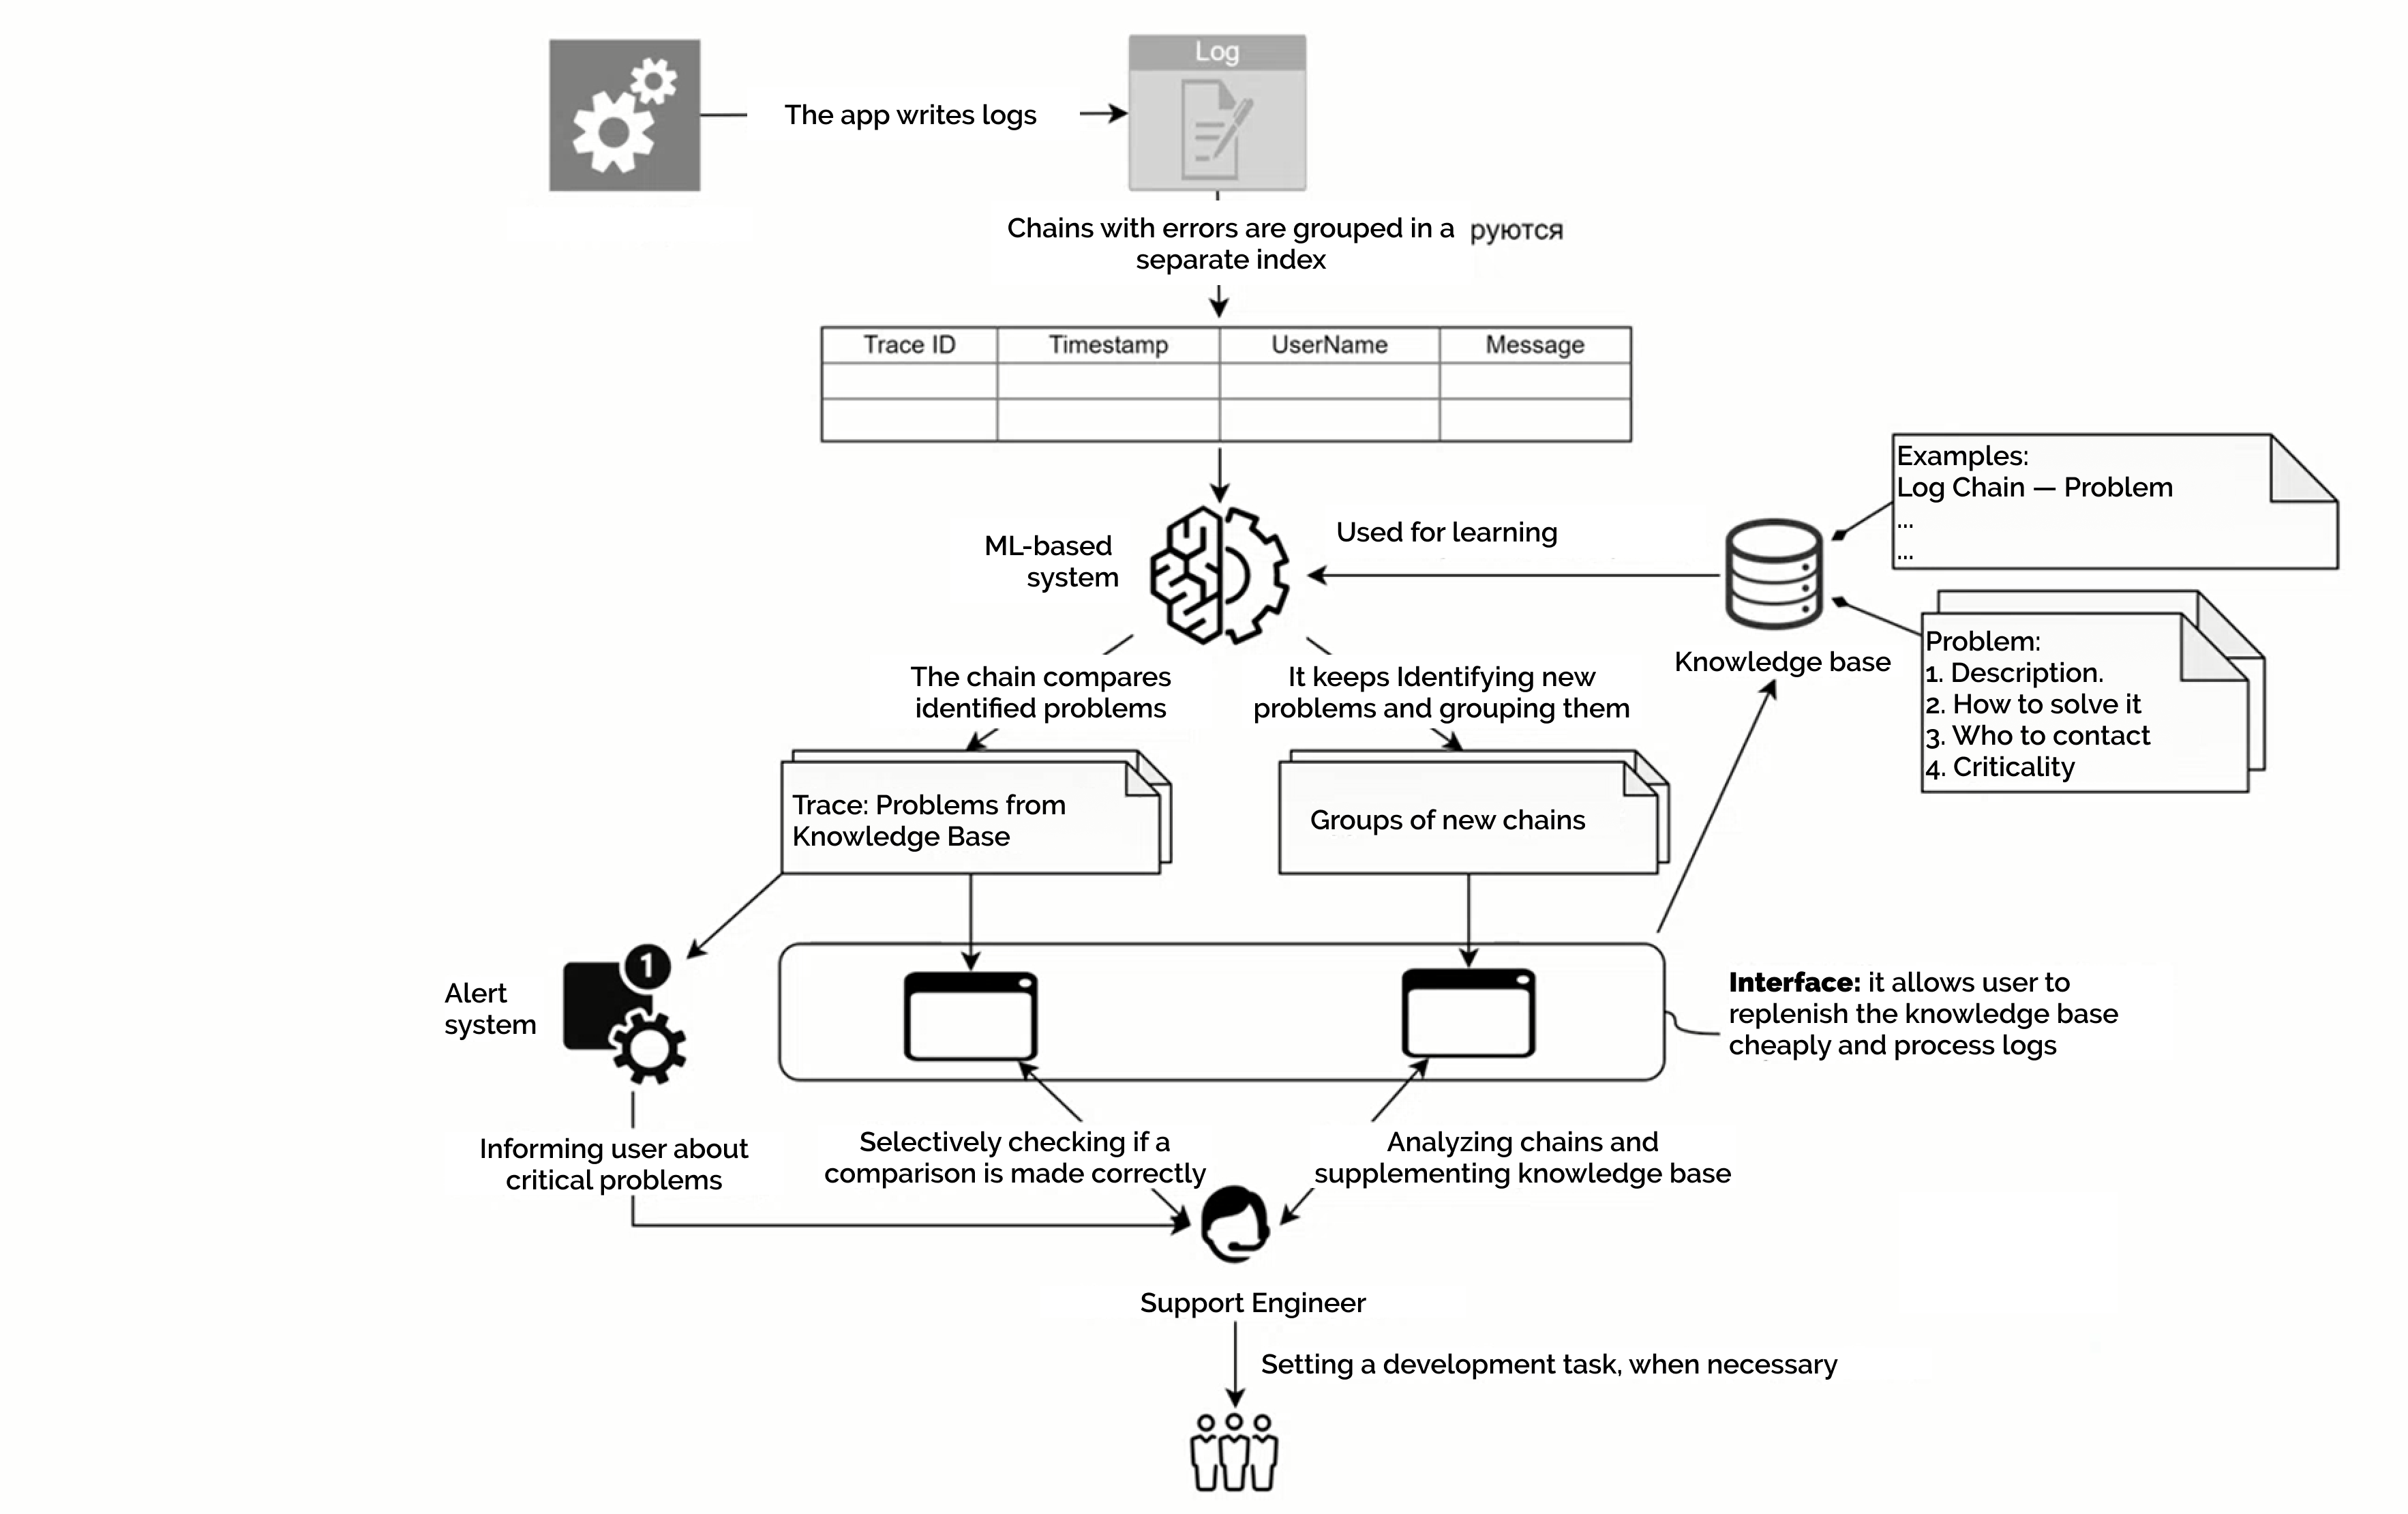
The problem-detection platform uses machine learning to detect early signs of failures in logs. Unlike humans, it is easy for a robot to look through tens of thousands of log chains and find the telltale signs of technical failures. A trained model can use the accumulated experience to record future problems in the same way. From this data, engineers can decide: either get the bug into development or skip it because it’s a typical bug. As a result, support gets rid of routine, its efficiency increases qualitatively.
The solution consists of three applications: one analyzes the logs and saves the results of the analysis in the database, the second updates the model once a day, i.e., provides the ability to train, the third (a console utility) allows user to adjust the results for additional training of the model. Engineers also have a dashboard in Kibana, where user can immerse into the desired events.
The service collects the results of the analysis in an Excel spreadsheet, where user can see general statistics on the problems encountered, a breakdown by class and potential threat, and the dynamics during the day. The user can also see which events are regular and which occurred for the first time.
The dataset for the training model has been assembled as follows:
Taking 130,000 logs from the system (this is a figure for 5 days);
Using a script to select about 3,500 unique logs with similar messages;
Grouping them into 37 files according to their level of similarity;
Filling in the descriptions by which the model assigns the error to a particular cluster and a particular group.
![]()
Last year, the support team of our high-loaded sales system started working with the product prototype. During the very first weeks of using it, thanks to PDP support, we identified several bugs and technical problems, including a bug that was affecting a critical business process.
Over the first months, the work was routine as it was necessary to train the model. To do this, engineers manually marked errors in incoming logs. We worked on tens of thousands of logs so that PDP could learn to detect errors in them.
And over time, the results became more and more obvious. The main thing is that it has become possible to work efficiently with a large number of log entries. There are now about 58,000 events a day, and unlike humans, the system reads every line. Our tech support sees the dynamics of known cases and quickly notices errors which were previously unknown.
All of this is very valuable information for the tech support. For example, you can see that a few dozen errors can be more serious than a thousand incidents. If the latter are spread over a 24-hour period, there may be no problem, and the errors are technical in nature. But a peak of a small number of errors in a short time can be a threat.
In practice, this means that the team does not find out about problems from the customer or users, but releases a hotfix literally within half an hour of release which is a true figure.
At the moment, the service is at the prototype stage. The ultimate goal is to make true MLOps with automatic and continuous data collection processes for training, model retraining, and model publishing. Plus, technologies to provide fault tolerance and scaling under load and continuous maintenance during operation.
To reduce the manually performed work of the helpdesk and the involvement of specialists in PDP, you need to define the criticality of events and more precisely and correctly assign them to one of the classes. In machine learning theory, the work of identifying new features is called Feature Engineering. As a result, PDP will only sound the alarm when support really needs to pay attention to bugs.
Another important direction is to handle medium-critical errors, if their number starts to grow rapidly. Sometimes, a dense flow of not-so-significant failures indicates serious problems - such cases may not alarm PDP, but they must be caught. To implement this qualitatively new feature, an additional model will be added to the system.
Let’s not forget about UX. Now the support team looks at logs in Kibana, while event analysis and retraining of the model is done in Excel. The final version of PDP will have a single window to look at a summary of errors in a class, postmark events and send data for re-learning. We also plan to implement predicative input, so that the system will suggest already known problems for entered characters or inform us that a similar chain has already been marked in the past.
However, according to the support feedback, already at the prototype stage PDP has proven its usefulness:
“The picture in terms of the criticality and frequency of problems that arise looks objective. Already in its current form, the tool has become a masthead for post-release launches, thanks to the fact that you can identify errors instantly.”