These metrics save PMs from unpleasant surprises during the sprint
We share our set of metrics that really help to control what is happening in the team and solve problems before they arise.
As we discussed in one of the previous articles on project analytics, the main problem is to ensure that graphs and charts really provide valuable information and they don’t just show what a complex project a team has, how many indicators it has, and how well everyone is working since there are almost no red numbers on the screen.
Project analytics should grow out of practice and everyday work. First, we build the right processes, then we define key indicators and thresholds, and only then we attach analytics to them.
This is the path we ourselves have traveled over the past couple of years - we have created a process and technology platform for all teams, introduced a single project template and other unified approaches. After that, a set of simple and effective metrics suggested itself - so that all PMs speak the same language and that the quality of our products is stable throughout the company.
In essence, these metrics present our general requirements for maintaining tasks. That each task should have a description and a responsible person, that they should be decomposed, that tasks should not take more than 8 working hours, and so on. If everything works as it should, the team will have a consistent workload and the number of surprises during the sprint will tend to zero.
Of course, all indicators also need to be automatically collected. But we have this provided by default - we work in the TFS (Azure DevOps) tracker, so that all information on tasks and projects is always at hand, and standard tools help create dashboards for any tasks.

What metrics to track
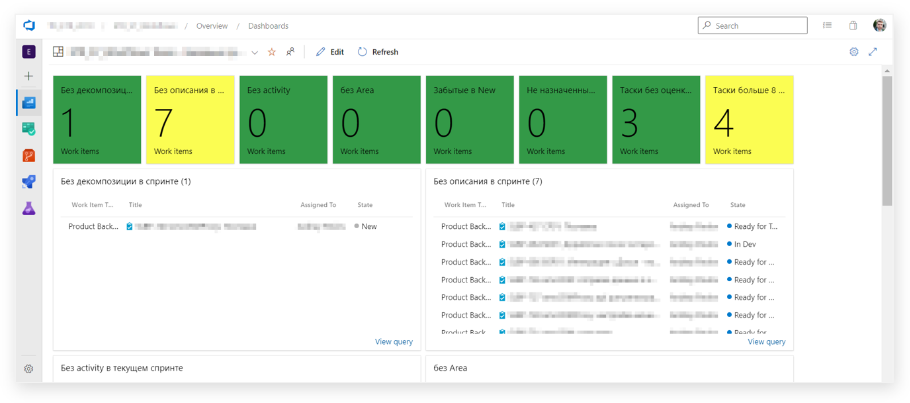
As a result, we got eight basic indicators that easily fit on the TFS screen - on top is a “traffic light” for a quick assessment, below is more detailed information on each indicator:
What metrics are included in the panel:
1. Without decomposition in a sprint. Shows how many PBIs are not broken down into tasks (tasks). And this means that according to PBI, the load per team was not fixed in the sprint. Without this, the team does not have an implementation plan as such, and the PM does not have an understanding of what the scope of work for this sprint is.
It is clear that sometimes “solid” PBIs have the right to life (for example, design can be difficult to distribute into separate tasks). Therefore, the PM is free to set the thresholds that he sees fit. Plus, we automatically screen out PBIs with statuses Done, Ready for Estimate, Ready for Release, Blocked, tasks in analytics - it is assumed that such topics do not require immediate attention.
2. Tasks without Description. The description is important to keep track of to make it easier for developers and other stakeholders to understand what this PBI is about in the future. In addition, undescribed tasks often include topics that arrive urgently from the customer - it is also important not to miss them.
3. Tasks without Activity. This indicator serves to correctly account for resources at the end of the sprint. It is important for a PM to understand how much time was spent on analytics, design, development, testing, and other activities. As a result, a correctly specified Activity is used for second-order analysis: command load, execution dynamics, and bottlenecks in implementation plans.
4. Tasks without Area. This indicator ranks tasks by functional blocks of the product, and, on some projects, by platform (mobile, web frontend, backend). It is also used to control the operational load and dynamics of development in teams, to track which functional blocks have the most effort (in terms of the number of tasks in progress and scheduled/spent hours).
5. Forgotten in New. This includes tasks and bugs that have a description and do not have the Blocked status. That is, it is time to take them into analytics or development, but for some reason this has not happened yet. Sometimes TFS itself “forgets” to switch the status and leaves PBI in “new”, but it’s still worth checking.
6. Not assigned. This point speaks for itself - each task must have a responsible "owner".
7. Tasks without evaluation. A task is a job, and every job needs time. The presence of tasks without time increases the risk that either there will not be enough resources for them, or other work will have to be thrown out of the sprint.
8. Tasks over 8 hours. Such tasks may indicate either an incorrect decomposition or an incorrect assessment of resources by someone from the team. Or the task is really big and indivisible, but then it gets into the risk zone and requires constant monitoring of progress.
The main value of this panel is that it immediately draws attention to key points that can seriously affect the project in the long run. Missed an emergency task from the customer, misallocated resources, overloaded the sprint with topics - got a headache a couple of weeks later.
And this way you can quickly assess the situation every couple of days, click on the red squares, immediately go to PBI and fix the difficulties or leave a comment to the person in charge.
If you tighten up the mechanics a little, you can also track higher-level indicators - for example, Time-To-Market (the speed of creating a feature from an idea to release to the market), underload / overload of the team at the moment, compliance of business priorities with the load on the team, etc. .
How to calculate Time-To-Market by TFS metrics
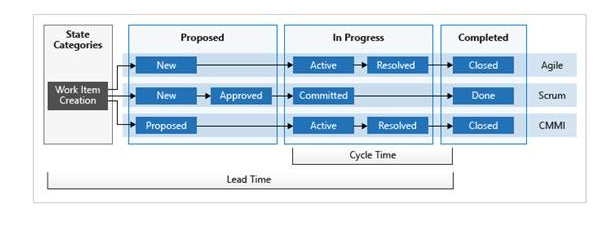
By default, TFS has rather uninformative analytics on the time spent on tasks. The tracker gives only two indicators:
- Lead Time - the time from the creation of the PBI to its transition to the completed state.
- Cycle Time - the time from the start of work on the PBI to its transition to the completed state.
To see what happened during the development itself, you need to open each specific task. It becomes very difficult to see patterns and draw practical conclusions.

Therefore, to control Time-to-Market, we use an OLAP cube that “feeds” on the data from TFS. We get a table where all closed PBIs and the period they spent in each status are visible. This is how the initial data from the cube looks like (here are all the tasks closed during the sprint and the time they were in each status):

PM sees how much time analytics takes and how much development takes, can calculate the median (or 85th percentile) to find out which step tasks spend the most time on. Time allocation can be further discussed in detail with the team. It becomes clear where the long Lead Time comes from - for example, when old tasks from the backlog are waiting in the wings. They are easy to separate from the big features that spend a lot of time in development. And you can draw conclusions - where the team acted suboptimally, and what can be improved in the process.
What do we end up with
As a result, PM can track the dynamics, see in which direction the numbers are moving from sprint to sprint. It becomes easier for him to keep the team under control, and the product owner can give the business customer realistic forecasts for the release of features.
And most importantly, the team gets rid of all the problems that can grow out of one small risk. Even Sun Tzu said that the best fight is the one that did not take place. In product development, it might sound like this: “The best problem is the one you fixed two weeks before.”