Image
A comprehensive guide on building a web-oriented report builder using Microsoft SQL Server Reporting Services. This post continues the story about the digital transformation of field staff training and evaluation.
We have a web portal used by several hundred users. They make up a step-like hierarchy in which every user has a supervisor. Such a delimitation of rights was required so the users could create events involving any subordinate staff members. Downward steps can be surpassed, i.e. a user may start an activity with any colleague of a level lower than theirs.
What events could these be? Training, assistance, or trading company employee performance reviews in a shop. Such events result in an iPad spreadsheet with the staff member being assessed with grades based on their professional skills and traits.
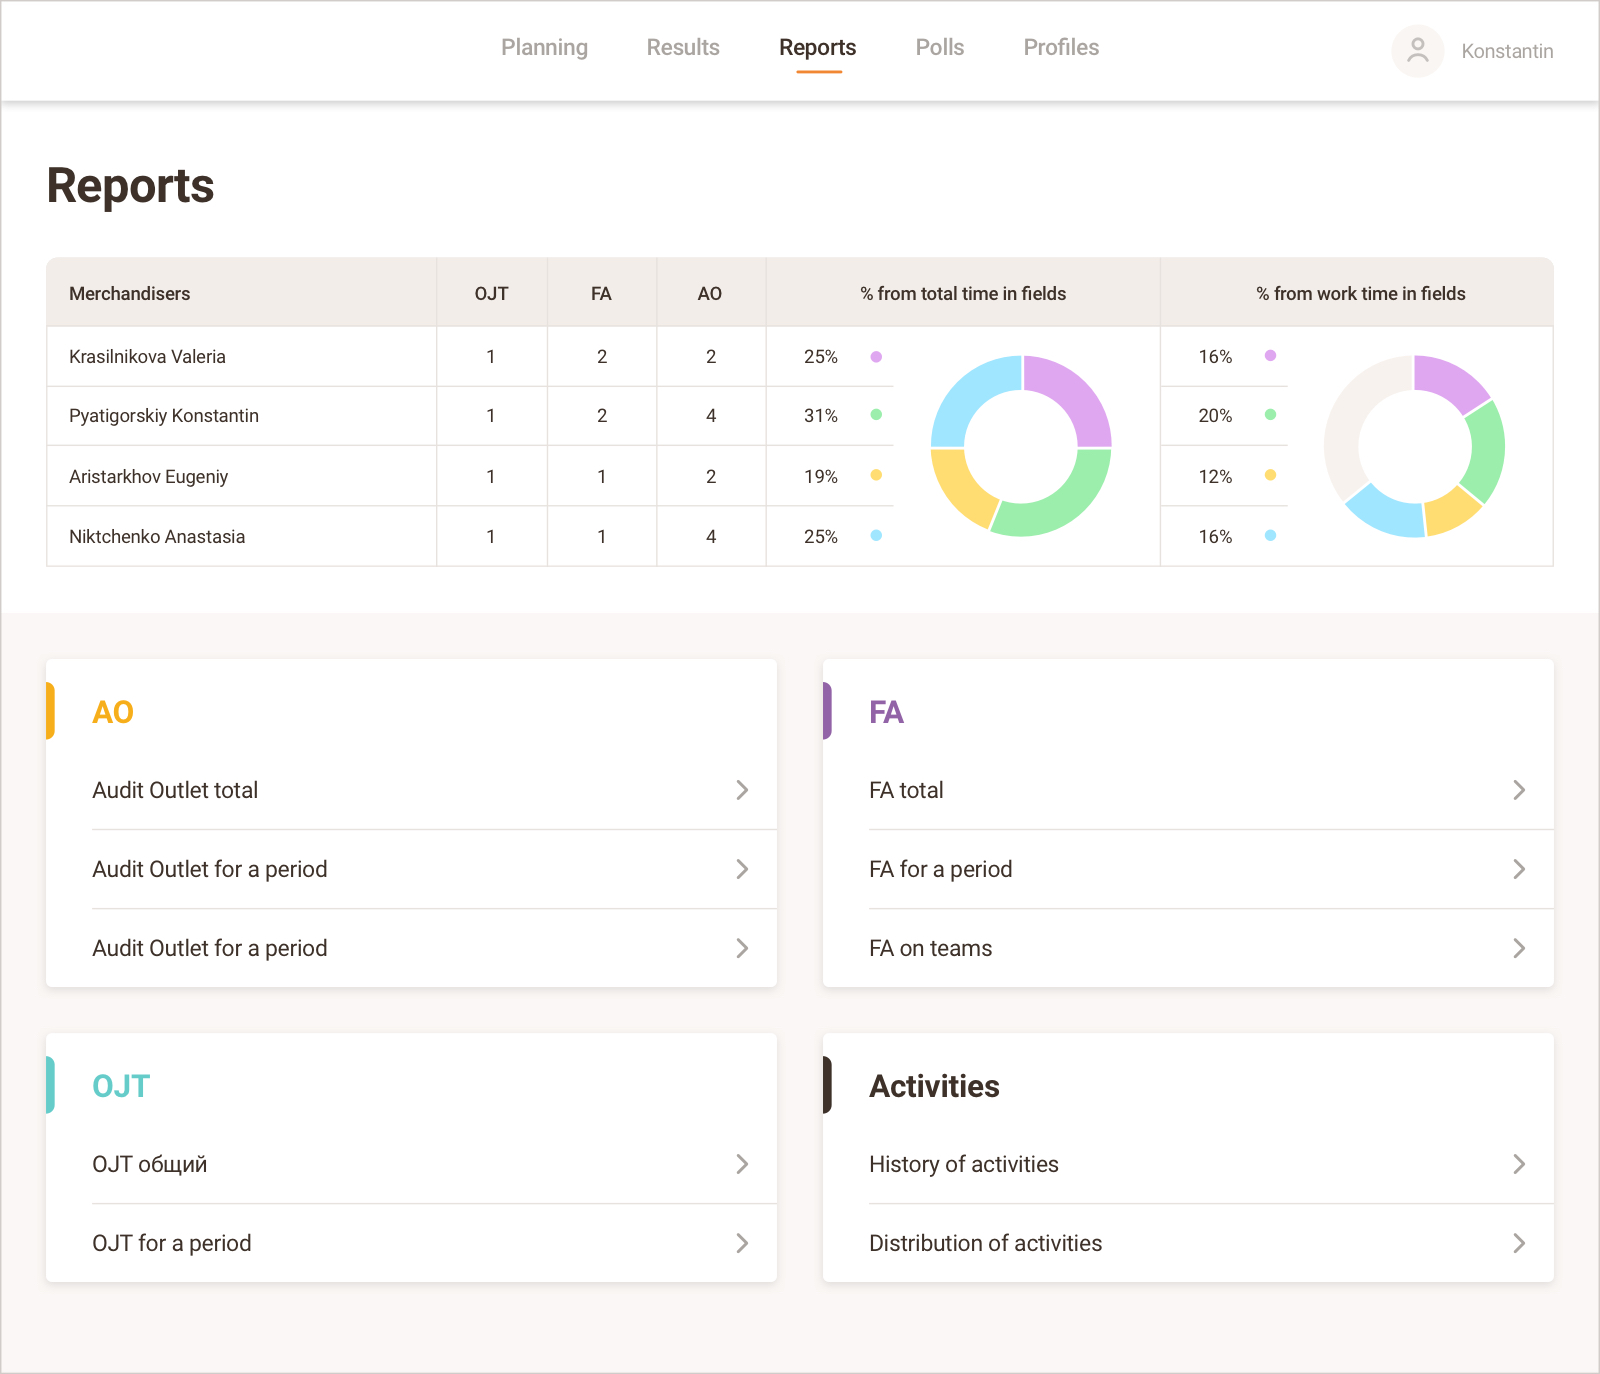
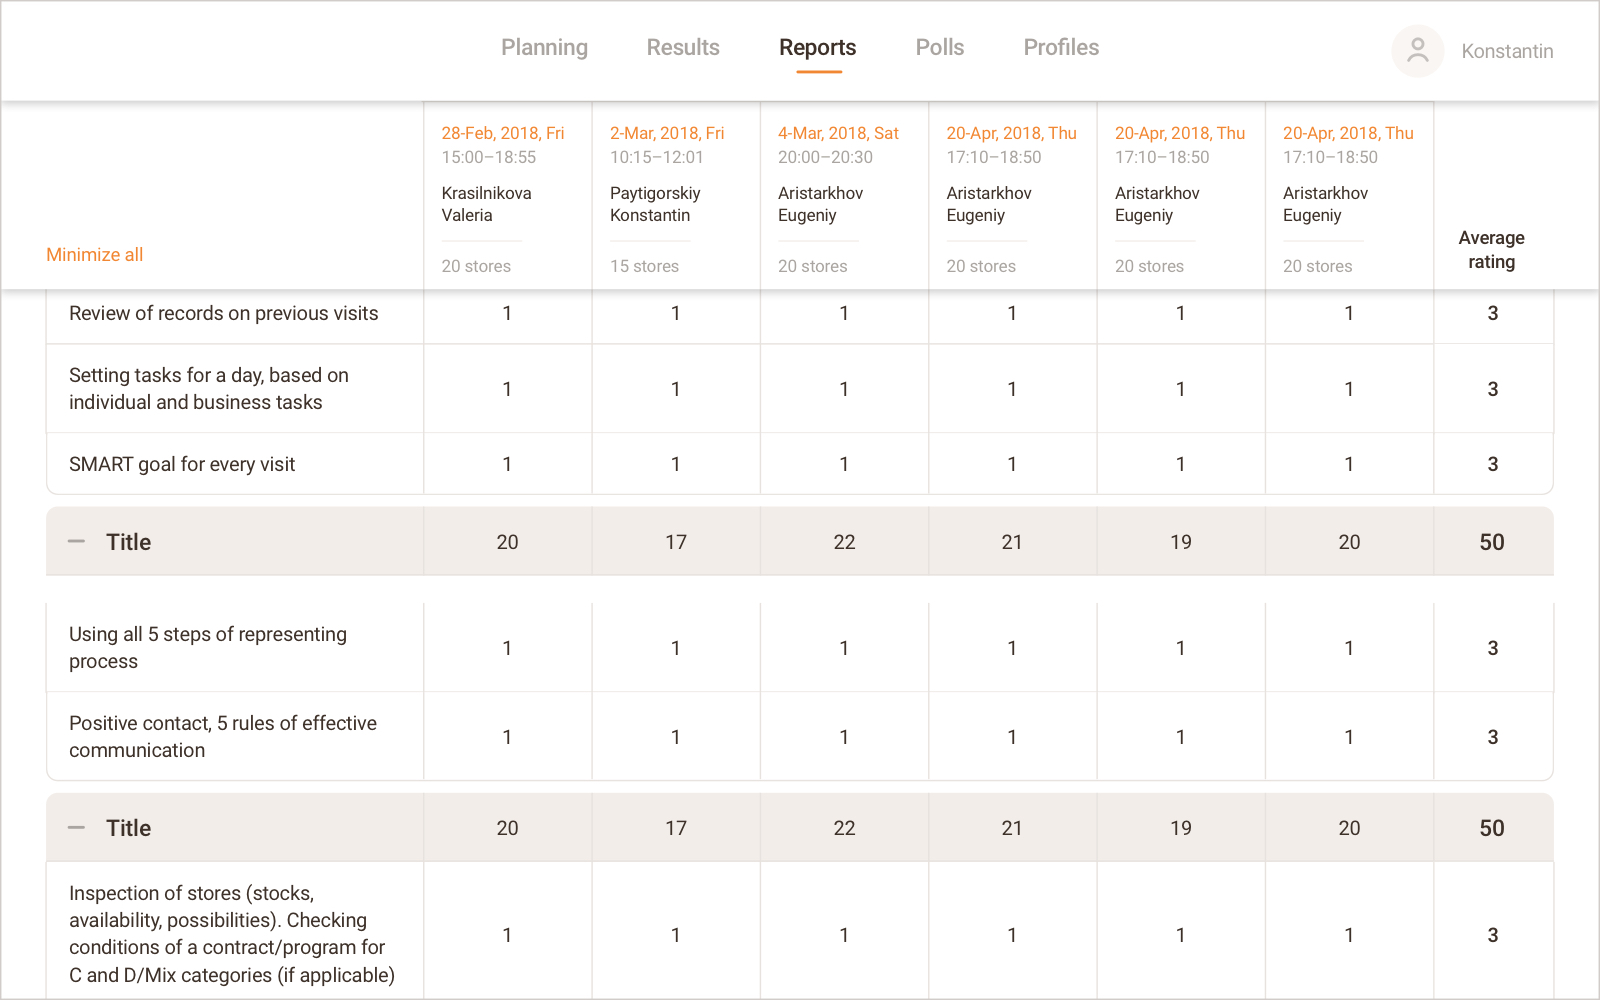
The spreadsheets may be used to gather statistics, for instance:
These are the statistics in the Reports that may be created via the web interface as XLS, PDF, DOCX, and printed out. All these functions are intended for supervisors of various tiers.
Report contents and formatting are defined in Templates, which enable specifying the parameters required. If users need new report types in the future, the system permits template creation, assigning changeable parameters, and adding a template to the portal. All of this without affecting the source code and other work processes of the product.
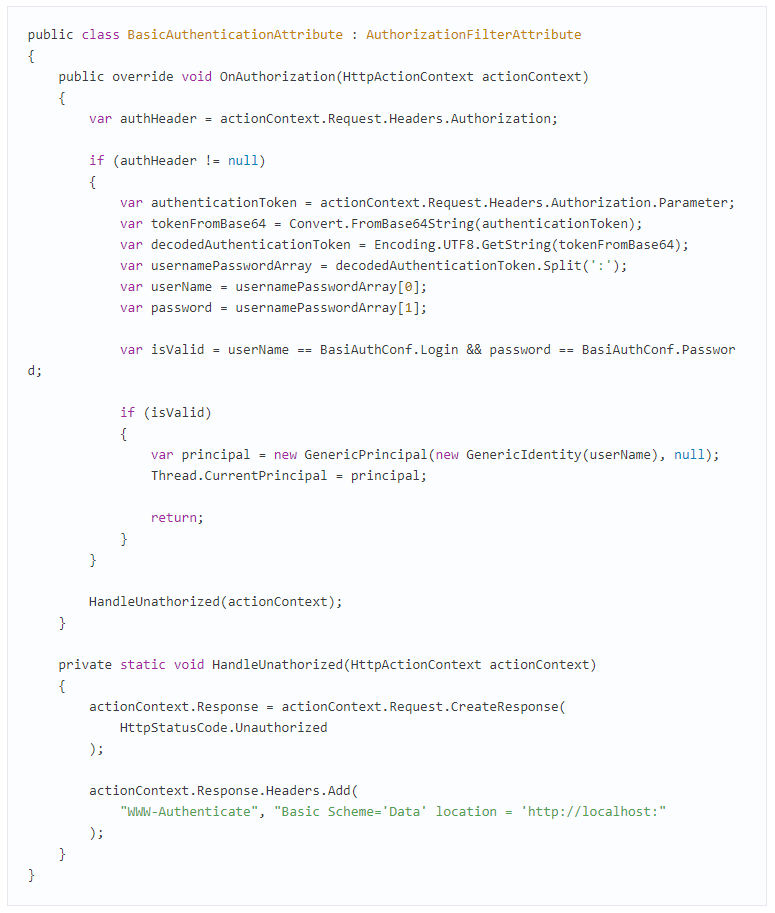
The portal operates on microservice architecture; the front part is written in Angular 5. The resource utilizes JWT authorization; it supports Google Chrome, Firefox, Microsoft Edge and IE 11.
All the data is stored on MS SQL Server 2014. The server has SQL Server Reporting Services (SSRS) package installed; the owner is using it without intention to switch over. This leads to the main restriction: outside access to SSRS is forbidden, so the web interface and SOAP can only be addressed from the local network via NTLM logon.
A bit about SSRS
A penny for your thoughts: how can a task be done without manual means, with minimal resource expenditure, and maximum benefit to the client?
Since the client has SSRS on a dedicated server, let SSRS do all the dirty work generating and exporting the reports. Then we won’t have to write our own report drafting service; XLS, PDF, DOCX, HTML export modules; and the API to match.
Thus, the task was to couple SSRS with the portal and to ensure the required functions are performed. So let’s follow the list of these scenarios -- practically every point was full of intriguing intricacies.
Since we already got SSRS, we have all the tools to manage report templates:
Summary: we create templates via SQL Server Data Tools, use Report Manager to upload them to the Report Server, configure them - and the job is done. We can generate reports and change their specs.
The next question: how do we request report generation via specific templates using the portal, and get the front result to display in the UI and perform a download in the format required?
As said above, SSRS has its own API to access the reports. Yet we don’t want to make these functions available from the outside for the sake of digital hygiene and security, we only need to address SSRS for the data in whatever shape we need and deliver the result to the end-user. Report management will be run by the client’s designated personnel.
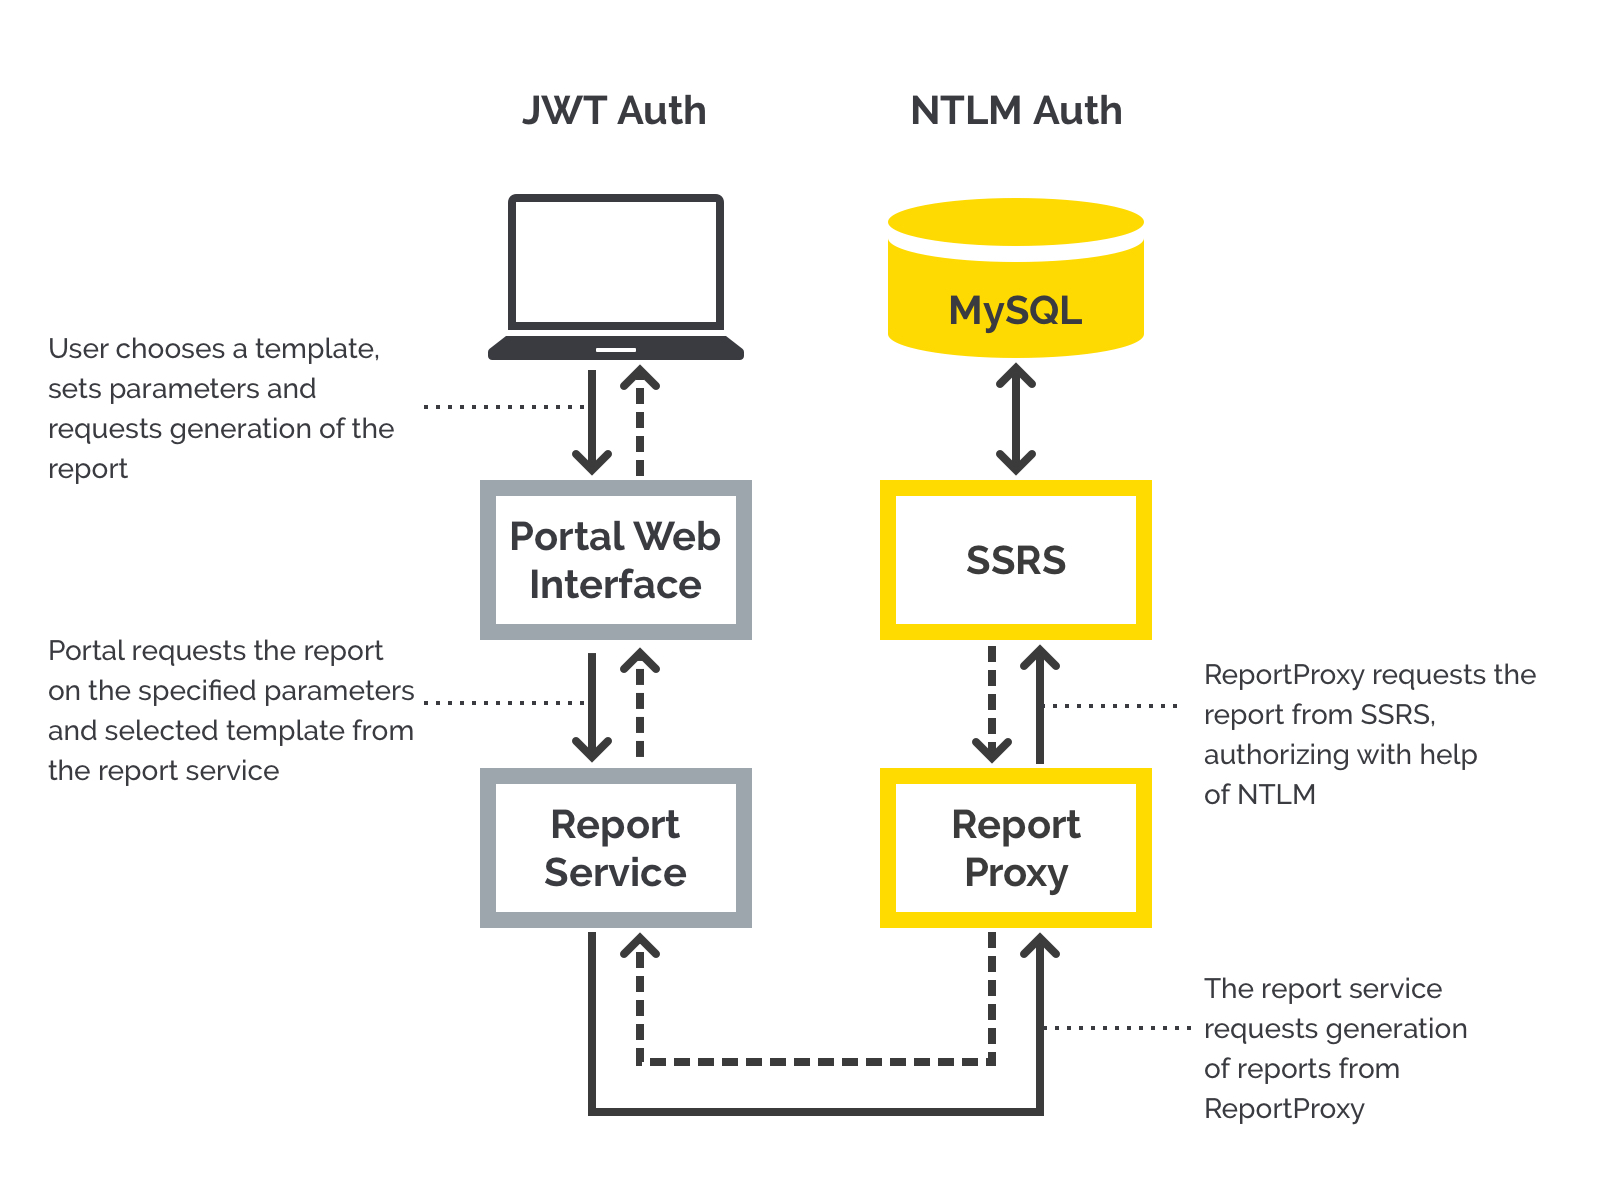
Since SSRS is only accessible from the local network, data exchange between the server and the portal proceeds via proxy service.
Let’s see how it works and why we need ReportProxy.
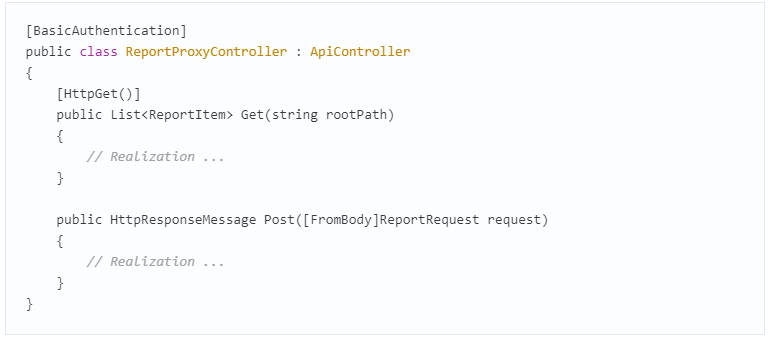
So, on the portal, we’ve got ReportService, which is addressed by the portal when reports are required. The service checks the user’s credentials, their rights, and transforms SSRS data into the format required by the contract.
API ReportService has only two methods, which are pretty sufficient for us:
Now we need these two methods to address SSRS and get the necessary data in the shape we need.
According to the project documents, we can access the report server via HTTP using the SOAP API interface. The jigsaw seems to be coming together… Yet we’re in for a surprise.
Since SSRS is locked from the outside world and it can only be reached through NTLM login, SOAP isn’t available from the portal directly. Plus, we’ve got our own wishes:
Here ReportProxy comes to the rescue; it’s on the same machine with SSRS and manages ReportService requests to SSRS via proxy. That’s how a request is processed:
In fact, ReportProxy is an adapter between SSRS and ReportService.
The controller looks like this:
That’s what the resulting process looks like:
The front sends an HTTP request to ReportService:
We got a functional system that requests the list of templates available, check SSRS for reports, and delivers them to the front in any supported format. Now we have to display the generated reports on the front according to the parameters set and make them downloadable as XLS, PDF, DOCX files, and printable. Let’s start with the display part.
This may seem quite unremarkable - a report arrives in HTML so we can do whatever we want with it! Embed it into a page, apply design styles, and the job’s done. However, there were plenty of waterstones.
According to the design concept, the portal’s report section is consist of two pages:
1. Template list, where we can:
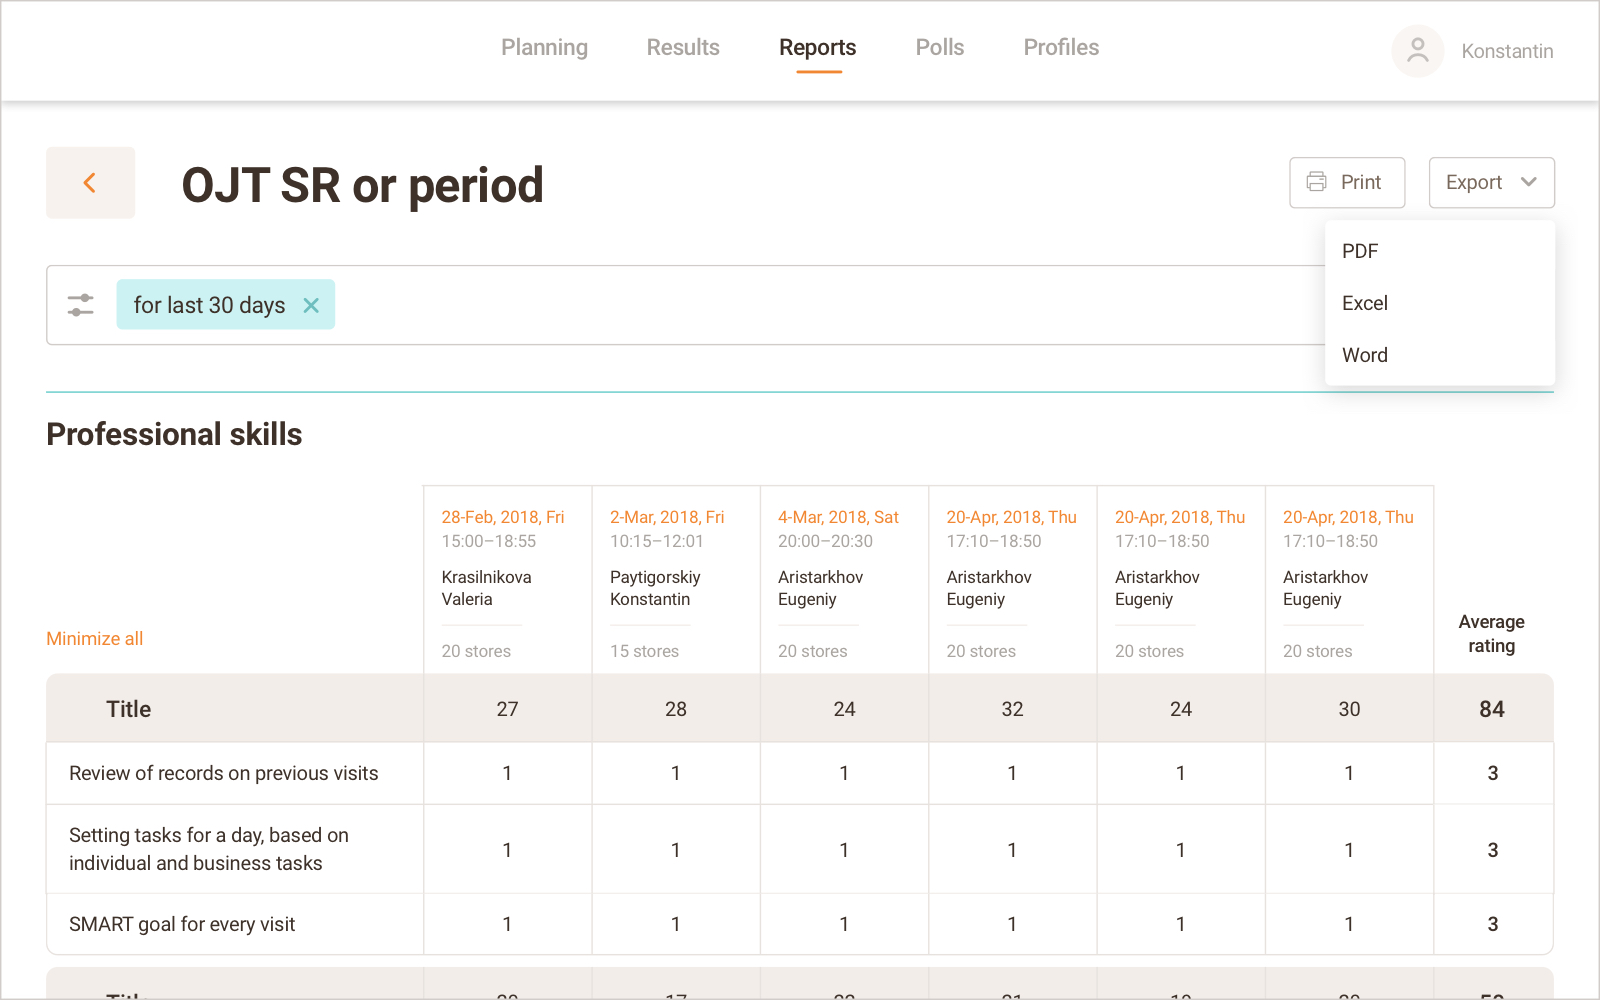
2. Report generator, where we can:
No issues arose on the first page, so we won’t review it further. Yet the report generator made us put on the engineering hat to make all the designated functions usable by living humans.
According to the design concept, the page had to contain a display area so that a user could see their report before its export. If the report doesn’t fit into the window, it can be scrolled horizontally and vertically. A common report may take up several screens, so we need stacking blocks with the row and column names. Otherwise, users will have to scroll back to the spreadsheet header all the time in order to recall what each cell means. Or it may be even easier to print the report out and keep the required sheets close, yet that renders the screen spreadsheet totally useless.
So, no one can do without the stacking blocks. And SSRS 2014 cannot anchor rows and columns in HTML documents, only in its own interface.
Then we remembered that modern browsers support the CSS sticky feature that provides the functionality we require. We set the position: sticky on the marked cell, the mark left or top offsets (left and top features), and the block will remain locked during the vertical or horizontal scroll.
We had to find a parameter that CSS may grasp at. Cells’ own values that let SSRS 2014 anchor them in the web interface are lost when imported to HTML. So, we’d mark them ourselves — we just needed to understand how.
After a few hours of reading documents and discussing everything with the team, we thought there were no options. Then, as always happens, we stumbled upon a ToolTip field which enabled the display of pop up tips for cells. We discovered that in the exported HTML code it was moved into the tooltip attribute — right on the tag belonging to the customizable cell in the SQL Server Data Tools. There was no choice — we couldn’t find another option to mark cells for anchoring.
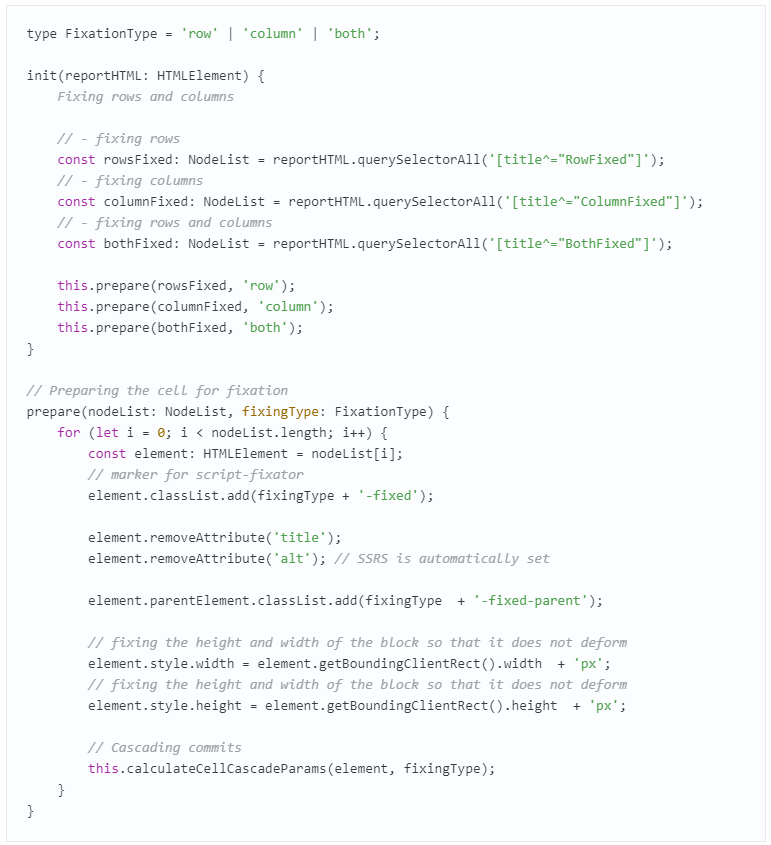
So, we needed to create the rules for marking and deliver the markers to HTML via ToolTip. Then using JS, we swapped tooltip attribute to CSS class according to the specified marker.
There are two ways to lock cells; vertically (fixed-column) and horizontally (fixed-row). One more marker may be assigned to corner cells that remain anchored when both axes are scrolled — fixed-both.
The UI will be making the next step. When an HTML document is received, it must be searched for all HTML elements with markers; their values will be recognized, an appropriate CSS class assigned, and the tooltip attribute deleted so it doesn’t pop up when the cursor approaches. It must be noted that the final markup consists of tables embedded into each other (table tags).
View the code:
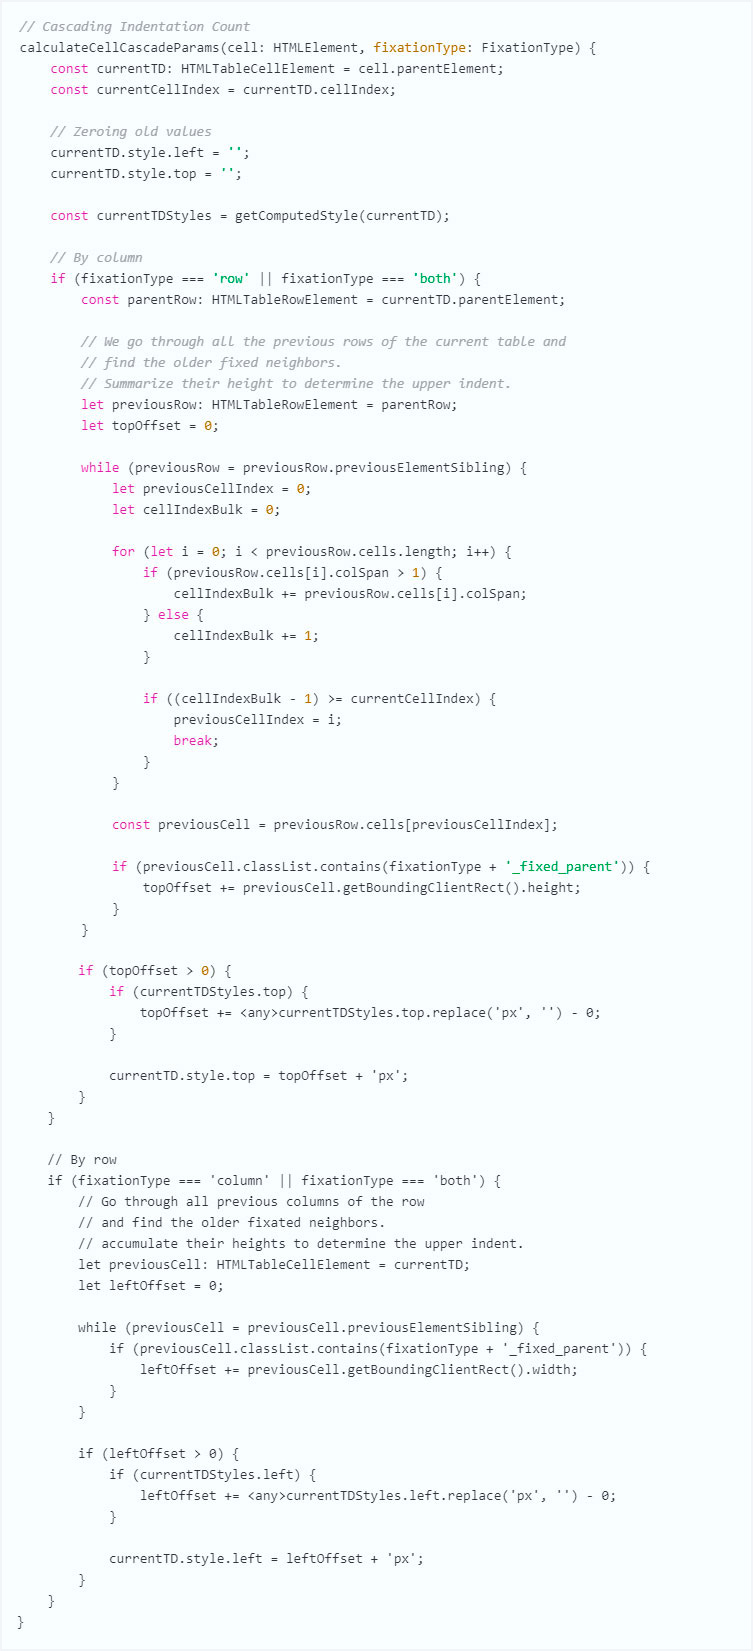
Here comes a new problem: given cascade behavior, when several blocks get anchored in a spreadsheet at once, back to back cells will overlap if these blocks move in the same direction. It is also unclear how far each following block must step back — we’ll need to use JavaScript to calculate the offset considering the height of the opposite block. This concerns both vertical and horizontal locks.
This issue was fixed with the help of the following correction script:
The code checks tags of the marked elements and adds the locked cells’ specs into the offset value. Height is added when rows stick to each other, width is used for columns.
This is the resulting process:
Since the sticky behavior is fully implemented via CSS while JT only participates in the preparation of an incoming document, the solution works quite swiftly and without lag.
Alas, the sticky blocks had to be disabled for IE since it doesn’t support the position: sticky feature. Other browsers — Safari, Mozilla Firefox, and Chrome — deal with it flawlessly.
Let’s move on.
To pull a report from the system, (1) a blob object is to be requested from SSRS via ReportService, (2) the window.URL.createObjectURL method is used to obtain the object link via the interface, (3) the link is inserted into a tag, and a click is imitated to download the file.
This works in Firefox, Safari, and all versions of Chrome except the Apple one. To make IE, Edge, and iOS Chrome support the function we once again had to put on our thinking caps.
In IE and Edge, the event simply won’t trigger the browser request to download the file. It’s a feature of the browsers that a click imitation should require the user’s confirmation for a file download as well as a clear instruction for further actions. We found an answer in the window.navigator.msSaveOrOpenBlob() method which both IE and Edge have. It can request the user’s permission for action and clarify what to do next. Hence, we had to got to find out if window.navigator.msSaveOrOpenBlob exists and act accordingly.
iOS Chrome offers no such lifehack, so instead of a report, we ended up with a blank page. After some network search we found a similar story which said that, in iOS 13, this bug would be fixed. Alas, we were writing the app in the iOS 12 era, so we decided to stop wasting time and basically disabled the button in iOS Chrome.
Now let’s see what the final UI export process looks like. Report’s Angular component has a button which launches the following steps:
Once this is sorted out, the last adventure remains.
Now we can view a report on the portal and export it into XLS, PDF, DOCX. We just need to implement a document printout to end up with a neat jumbo report. If a table is split into pages, each of them must contain headers — the very same anchored blocks we mentioned before.
The simplest way is to take the current page with the report displayed, hide all the unnecessary bits using CSS and send it for printing using the window.print() method. Yet it won’t work for numerous reasons:
All this can be fixed with JS and CSS, but we decided to save developers’ time and search for an alternative to window.print().
SSRS can fetch us a PDF with a pleasant page layout right away. This saves us all the troubles of the previous option; the only question — was whether we could print a PDF via browser?
Since a PDF is an external standard, browsers support it using various viewer plug-ins. If the latter is missing, we once again need an alternative.
What if we were to display a PDF on a page as an image, and then send this page to print out? Angular already has libraries and components that provide such rendering. We looked around, ran some trials, and implemented it.
To avoid the data we don’t want to print, we decided to move the rendered content over to a new page where we’ll run window.print(). The final process looks as follows:
After several trials, a JS code appeared on the page — it checks if all images finished loading before printing.
This way, the document’s appearance is entirely defined by SSRS template parameters, and UI isn’t involved. This reduces the number of potential bugs. Since these are images sent for printout, no damage or layout deformation is possible.
Disadvantages:
In our case, the frequent addition of new templates was not intended, so the solution is acceptable. Mobile platform performance was taken for granted.
That’s the story of how a common project makes us seek simple solutions for complex issues. The final product is meeting all design requirements and looks gorgeous. Most importantly, though we had to find unorthodox implementation methods the task was finished much faster than if we had embarked on developing an original reporting module. At the end of the day, we could focus on the business targets of the project.