Image
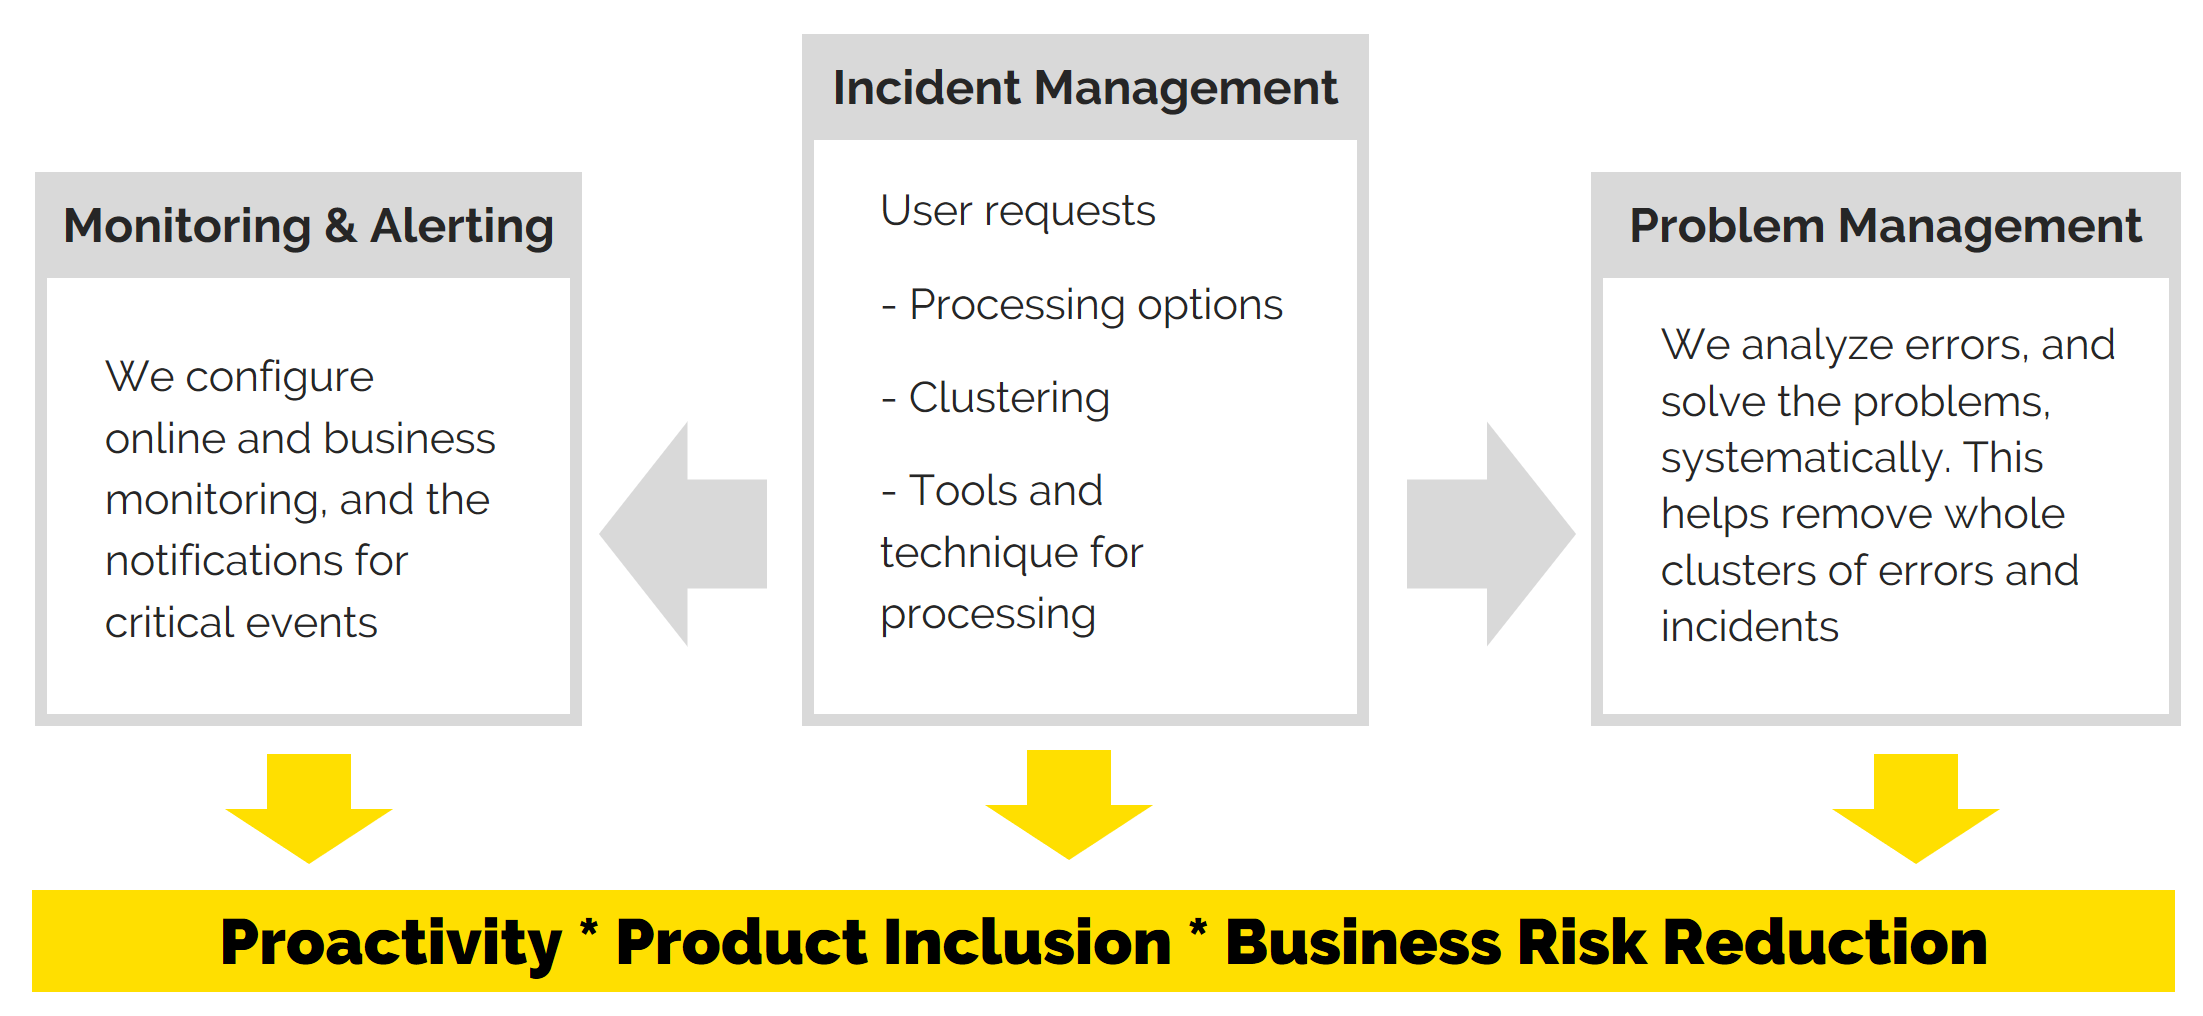
Monitoring, incident management, and a systematic approach to troubleshooting, are the main elements of the systematic technical support for products. Today we will tell you how to provide effective monitoring for a complex IT-product, and what processes can be automated to simplify the work of support engineers.
Monitoring is where you should begin setting up a product for technical support. From there, you can build a technology for processing requests (Incident Management), and developing a systematic approach to problem solving (Problem Management).
Monitoring makes it possible to build a proactive approach to technical support. Experts learn about problems by reacting to the first alarm signals, not when the failure has already occurred.
In general, monitoring answers two main questions:
Next, we will tell you how to organize monitoring which will answer these questions for you.
Types of monitoring:
As a rule, teams have no problems with technical monitoring. However, setting up business monitoring often causes difficulties: below is an article dedicated to our approach to solving this problem.
Four steps to launching business monitoring
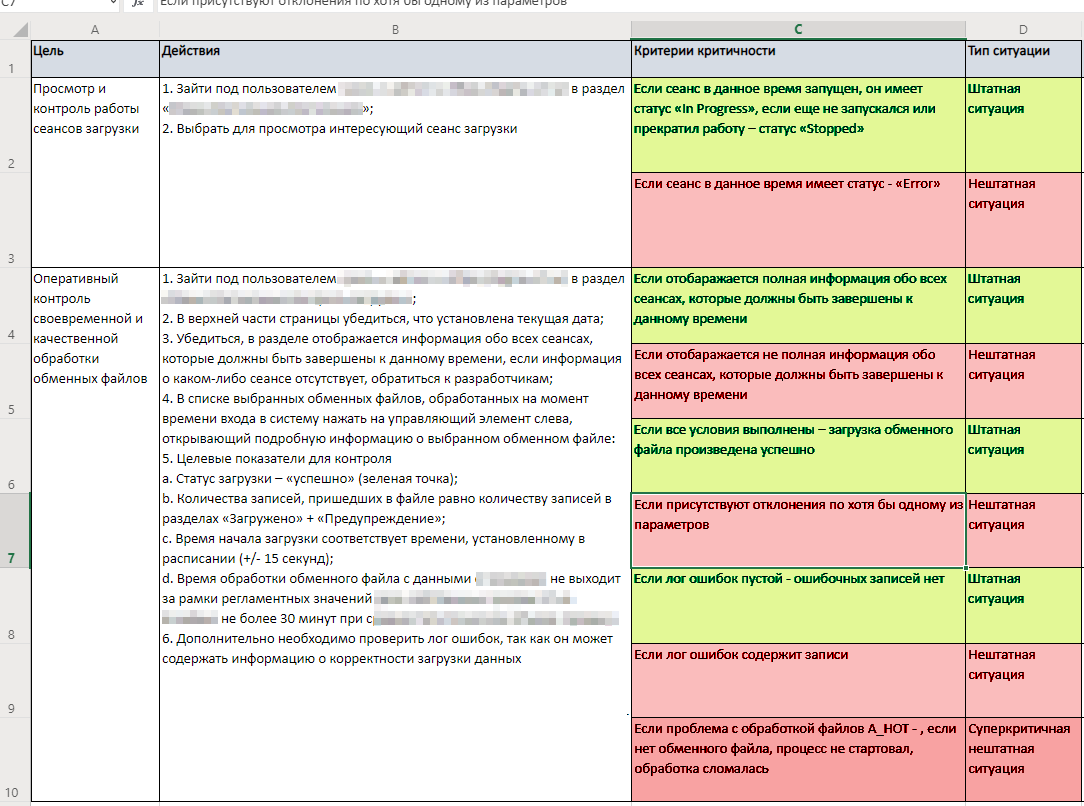
For the first step, you write down all the actions that users perform in the product. Step by step, you lay out what you need to do in the interface to get a particular result.
It is convenient to do this in a table. At this stage, there appear the following columns:
In the end, you get a detailed guide to all operations for which the product is used. From this data, you can then prepare tests to automatically check if the system is performing its tasks from the point of view of direct users.
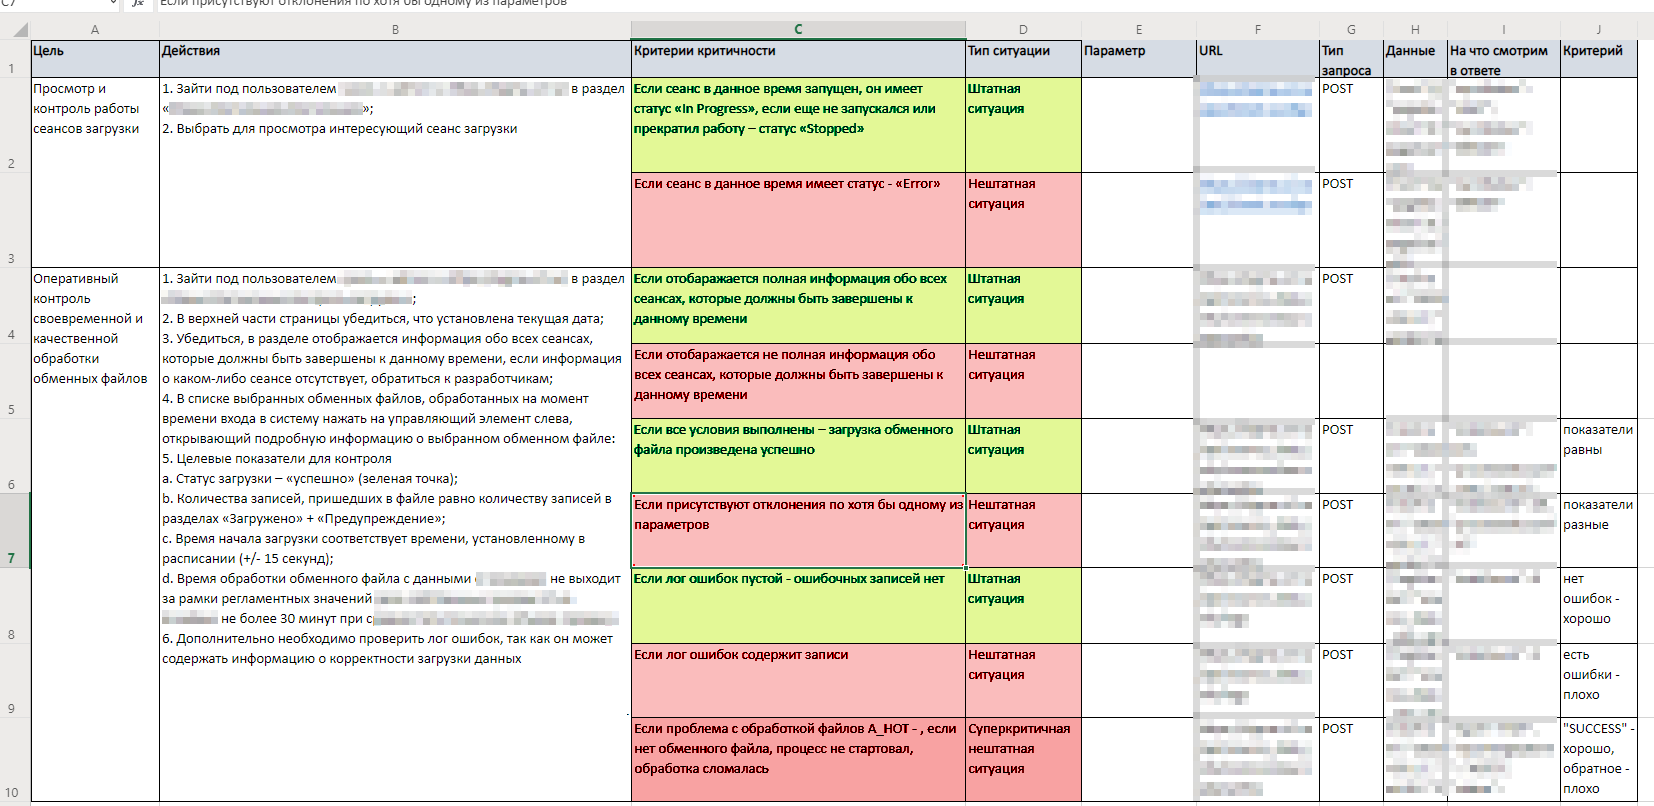
To automate these checks, this guide needs to be translated into a scripting language. User actions must be correlated with specific requests to specific services.
To understand what to look at in the output, we add the following data to the table:
Based on the results, your table turns from a description of scenarios into a complete guide with all requests and data in logs that indicate a positive or negative result (basically, whether it works or not).
Most corporate systems are closed from the outer Internet, and for such cases, you need to resolve the issue of authorization. In other words, you need to technically provide the capability for monitoring systems to send a request to the microservice and receive data.
To do this, you need to write a separate module that can receive authorization data and transmit it to the monitoring service. Technically, this is similar to the mechanism of cookie files in a browser: the system that we monitor transmits a token with a limited lifetime to the authorization service, and through this token, the monitoring tools confirm the right of access.
Now you can start automation and prepare alerts for processes. Developers write scripts to simulate user actions with a list of scenarios. Here you need to rely on business tasks and see by what time the support needs to know about a process failure in order to take action.
These scripts can be "fed" into almost any monitoring system. Personally, we like Zabbix, but it could be Grafana or another analytics engine you work with. Your table has everything you need for configuration.
As a result, we receive a mechanism that can log into the system and send post-requests to its services. All you need to do is set the alert thresholds and configure the report logic, and your monitoring has been put into operation.
Conclusion
Our experience shows that the production team often complicates the task for themselves by getting too involved in technological parameters. In fact, the process is rather simple and transparent. We showed this with a live example.
The key to the solution is to get into the shoes of the user who logs into the system every morning and checks whether it is coping with the given tasks. If you go to the method through the meaning of the product, the path to the goal becomes much shorter, and the monitoring results are easier to interpret and control.