Digital transformation of field staff training and evaluation
How to train thousands of field employees in dozens of cities – and not to drown supervisors in paperwork? We managed to do this with one of the largest distributing companies in Russia and ready to tell you how.

Our client is a federal manufacturing company. Its merchandisers are responsible for the availability of goods in stores, representation of them on the shelves, POSM materials (advertising), vendors’ knowledge about production, etc. Supervisors train, evaluate, and monitor field staff. There are corporate standards and a well-regulated process in place for that.
Previously, all valuable information regarding training results or evaluations was only recorded on paper. Over the course of the day, a supervisor and a merchandiser would together visit 20 outlets and in each outlet, they would have to fill out a summary worksheet. Then the worksheet had to be processed to prepare for feedback to be provided. What we have created now is a technological tool that helps supervisors plan out their teams’ development, record the results, and review them. In this article, we will tell you the details of how it went.
How we organized the development process
The development process consists of multiple stages. Within the bounds of the work the merchandiser has to perform, training is conducted on the premises of retail outlets. Support goes hand in hand with training and evaluation. Such continuous development solves two issues:
Rapid professional growth for beginners due to frequent accompaniment in the field
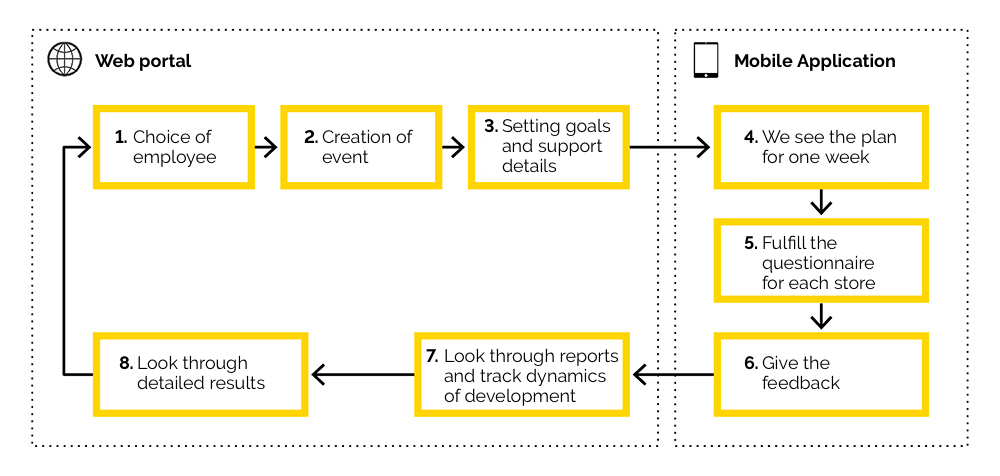
The supervisor chooses the merchandiser and sets 2 support goals, for example, developing presentation skills and handling objections. After that, the supervisor prints out the worksheet and goes with the merchandiser to visit 20 outlets. Over the course of the entire day, this supervisor monitors the work the merchandiser does, checks whether the employee took into account the tips and comments that were provided to him last time, gives recommendations, and records all the results in the questionnaire. At the end of the day, the supervisor sums up the results and devises a development plan, which is followed as of the next monitoring.
Maintaining experienced employees' quality of work through regular evaluations and outlet audits
Evaluation is performed in the same way as training: the supervisor accompanies the employee in the outlets and monitors the quality of their work. The audit takes place without the merchandiser. The supervisor visits the outlets himself, having previously printed out the key indicators for each outlet. During the visit, the supervisor fills out the summary worksheet and compiles a photo report on his phone. Then the supervisor adjusts the development plan and gives recommendations based on the obtained results.
Thus, by the end of the day, the supervisor completes a paper worksheet. After that point, he will need extra time to prepare the final feedback and input the entire team’s results into an Excel file. All this is instrumental in tracking the team’s development dynamics and planning future meetings. Within the course of a month, the supervisor must meet with each subordinate, of whom there are on average 7.
The difficulties were obvious:
- A large amount of paperwork had to be done. People would have to fill out a paper worksheet, which was inconvenient and rather tedious.
- Information was stored in different places: the merchandiser's evaluation was on a paper worksheet while merchandise layout photos were on their phones. And for feedback to be provided, the information needed to be gathered and processed.
- To evaluate the level of and understand the development dynamics of a particular employee or team, someone had to manually calculate the points on each worksheet and input those results into an Excel table.
- It is difficult to create a cross-cutting objective for the training so that each subsequent meeting would work toward a single result and take into account all the past meetings. The supervision history only existed in the form of the paper worksheet and was not connected to the results on the Excel table and was thus not analyzed in any way.
Contents of the solution
Our solution consists of a web portal and a mobile application for the iPad.

On the portal, the supervisor plans weekly training, evaluations, and outlet audits. Within the bounds of the monitoring, the supervisor fills out the mobile app worksheet: he evaluates the quality of the work performed based on the company's standards, plans out the goals, identifies employees’ strengths and weaknesses, and devises self-development tasks. After that, the supervisor sends feedback to the merchandiser and the results to the portal. On the portal, the supervisor analyzes his team’s or employee’s results as well as the development dynamics for the period. And he uses this to base future meetings off of.
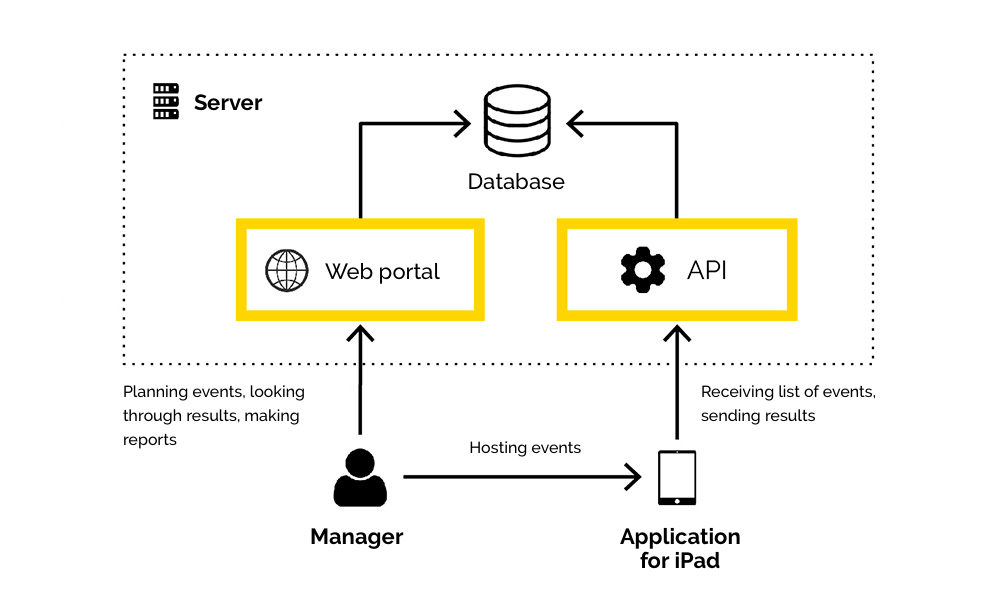
We developed the Angular 5 (the latest version at that time) portal, back-end on .Net Core 2.2, and mobile app on Swift.
The backend is based on microservice architecture and divided into 9 isolated services based on the principle of single responsibility. One service handles only planning, another – saving and displaying results, the third – interaction with the mobile app, the fourth – processing with photos, and so on. As a result, changes in one service do not affect the other services.
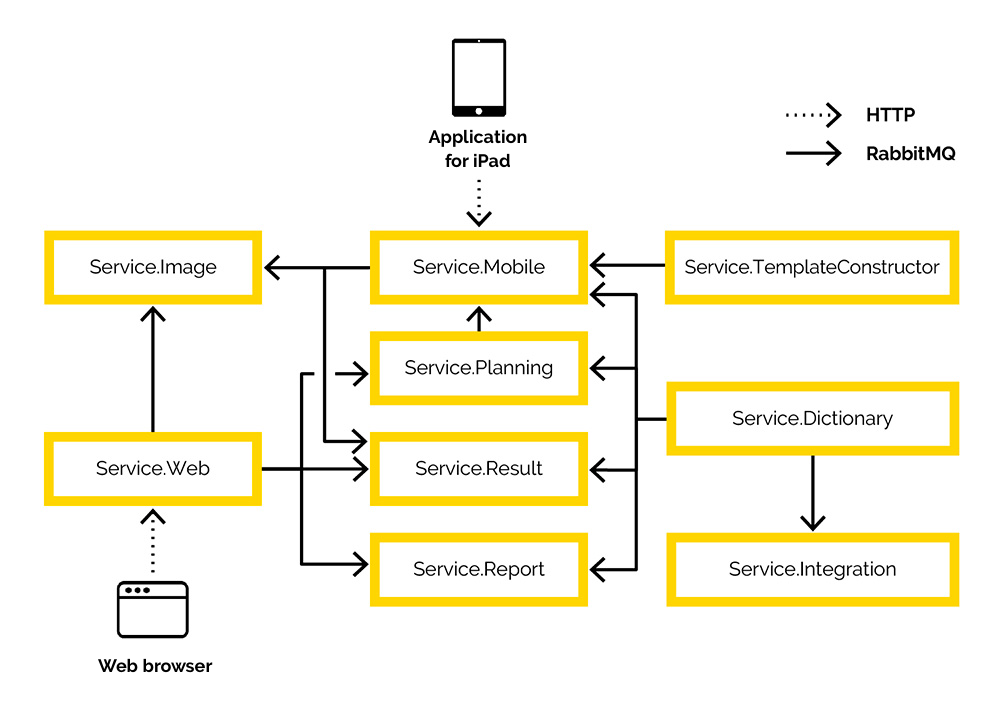
The microservices communicate with each other through the RabbitMQ+Mass Transit bus wire. Each service has its own database while access to "alien" databases is prohibited. There is also a separate customer database that stores the users' list along with their roles, the hierarchy, the list of outlets, product information, etc. Synchronization of this data is handled by the Service. Integration.
Meeting Planning
It turned out that there were too many factors that the supervisor had to take into account within the planning process:
- employee competence level
- sequences of activities performed
- the results of the latest training, evaluations, and audits
- strengths and weaknesses
- development goals and objectives
- time devoted to each employee per month
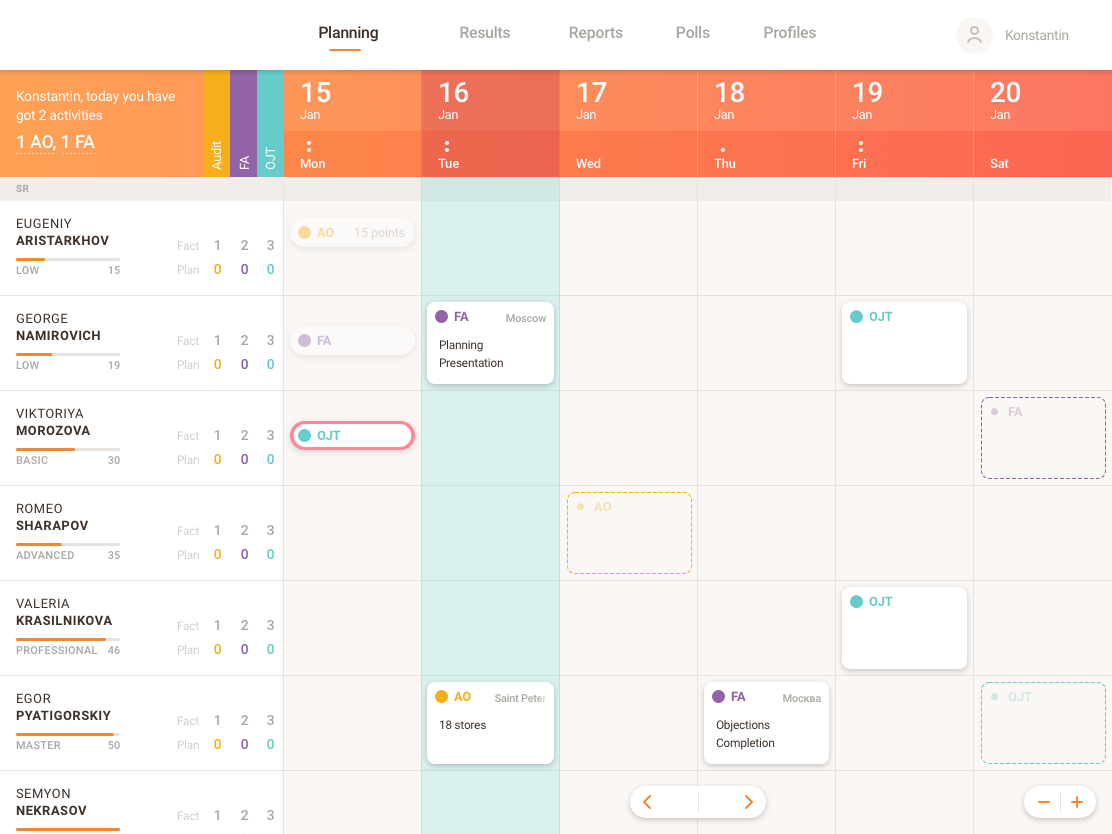
Therefore, we not only offered UI/UX but a well-thought-out and user-friendly planning methodology, so that the supervisor could see the overall information and make decisions without missing anything in the learning process. On the portal, the supervisor sees his entire team and plans a monthly series of activities, taking into account all the information as to the amount of time spent and activities carried out previously. This approach results in more uniform training for the entire team so that all the right people and indicators are in perspective. If this week you trained a new employee, you need to schedule certification for the next week to understand how they have progressed since then, and then you can audit the outlet. All of this is easy to organize within the bounds of the monthly presentation, and plans can easily be modified via drag & drop.
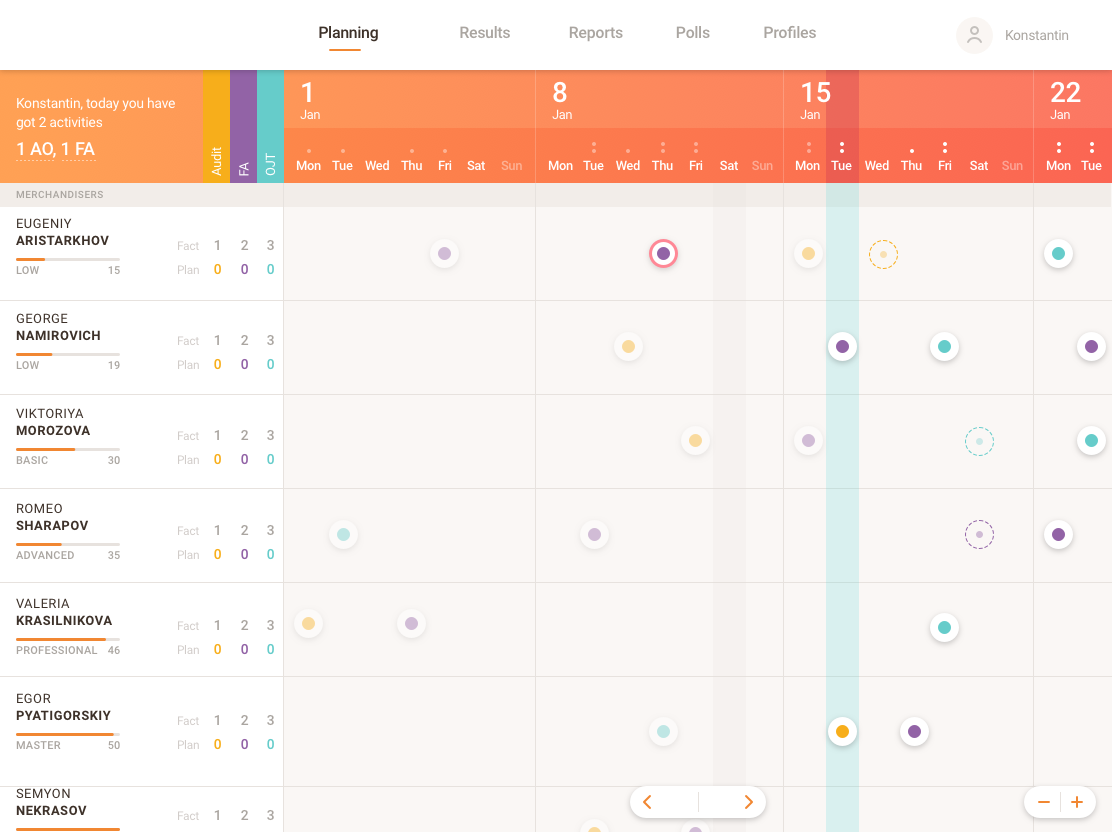
The weekly presentation is used for a more detailed establishment of planned activities to avoiding missing anything in the process.
Establishing Activities
The supervisor opens the planned activity card, which automatically displays info regarding the strengths and weaknesses of the employee based on past monitoring sessions, rendering it easier to remember their level. It also facilitates a well-evaluated decision with respect to choosing upcoming goals for training. In this case, the user can add comments and see the results of previous occasions in which they were accompanied.
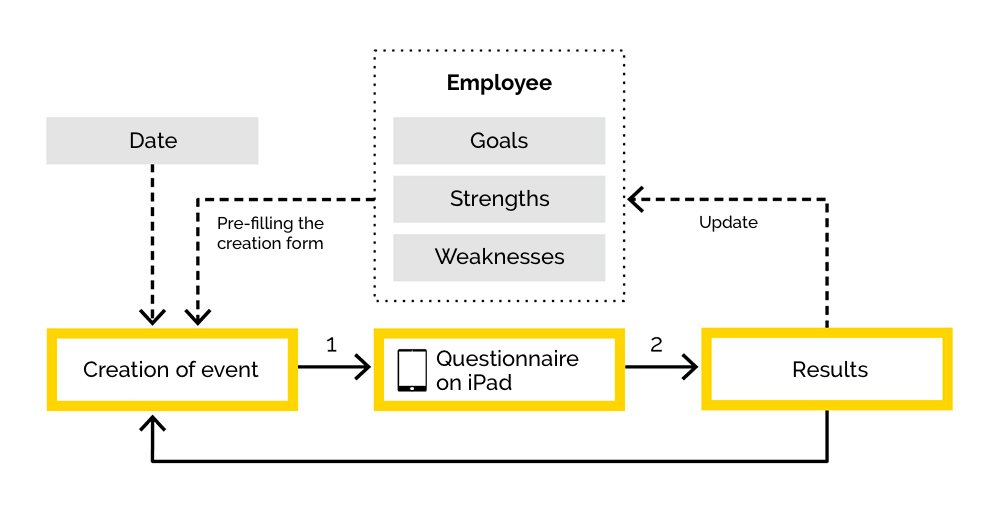
Here is an example of what a planned employee training in an outlet looks like:
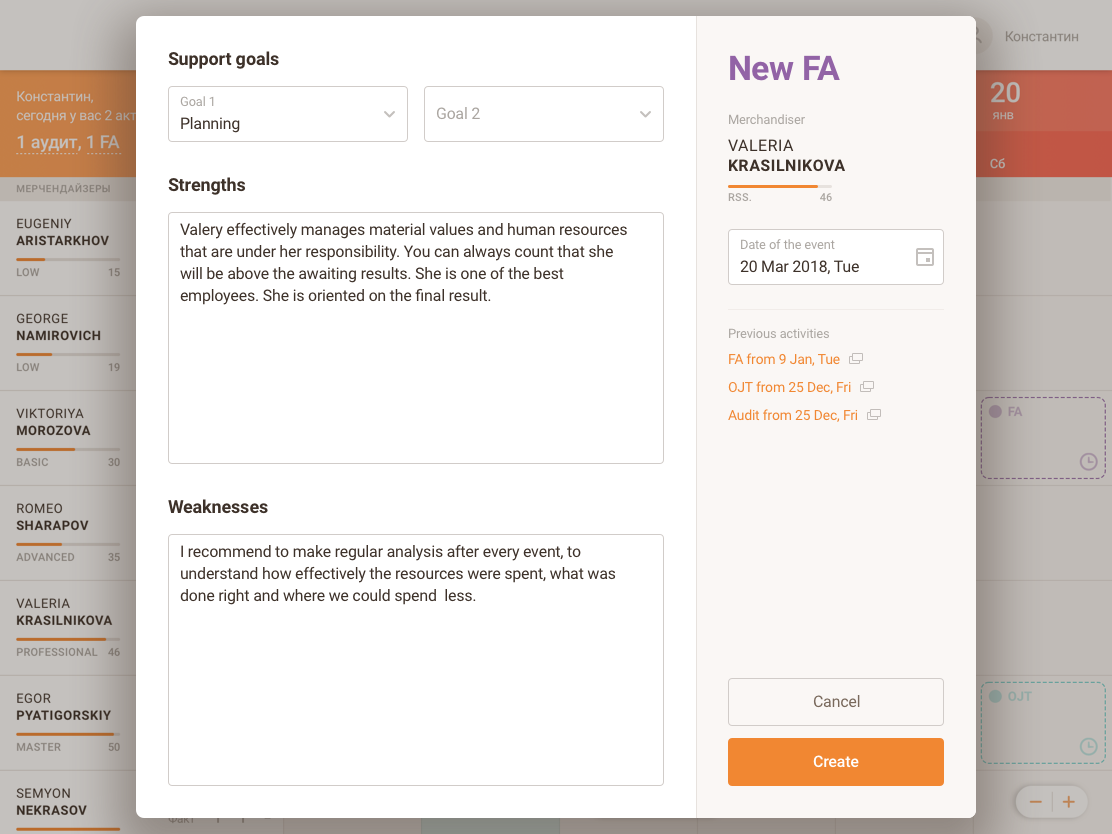
The planned activity card is directly linked to the worksheet template for the given event. We have created templates for all types of activities: training support, evaluation, and auditing. The template is a set of different blocks of questions and answers forming the worksheet.
In the template, you can create a list of questions, the order in which they appear, as well as their type, weight, and form:
- yes/no questions
- selectable options from a list
- the field for entering text, and so on
Different questions can be grouped together. For example, you can generate a block containing a list of products, and opposite each name, you have a field for the quantity of them. Or you can combine questions list into a group by activity, for example, all questions for testing objection handling skills. The web portal operates with a scheduling service that communicates all changes on scheduled activities to other services via the bus wire.
Mobile app synchronization with the portal
After planning everything on the portal, the supervisor opens the mobile app which automatically accesses Service. Mobile and requests a list of scheduled monitoring sessions and audits along with the corresponding worksheet templates.
Below we will show you the structure of the mobile app’s operation, on which the UI is built for monitoring or auditing.
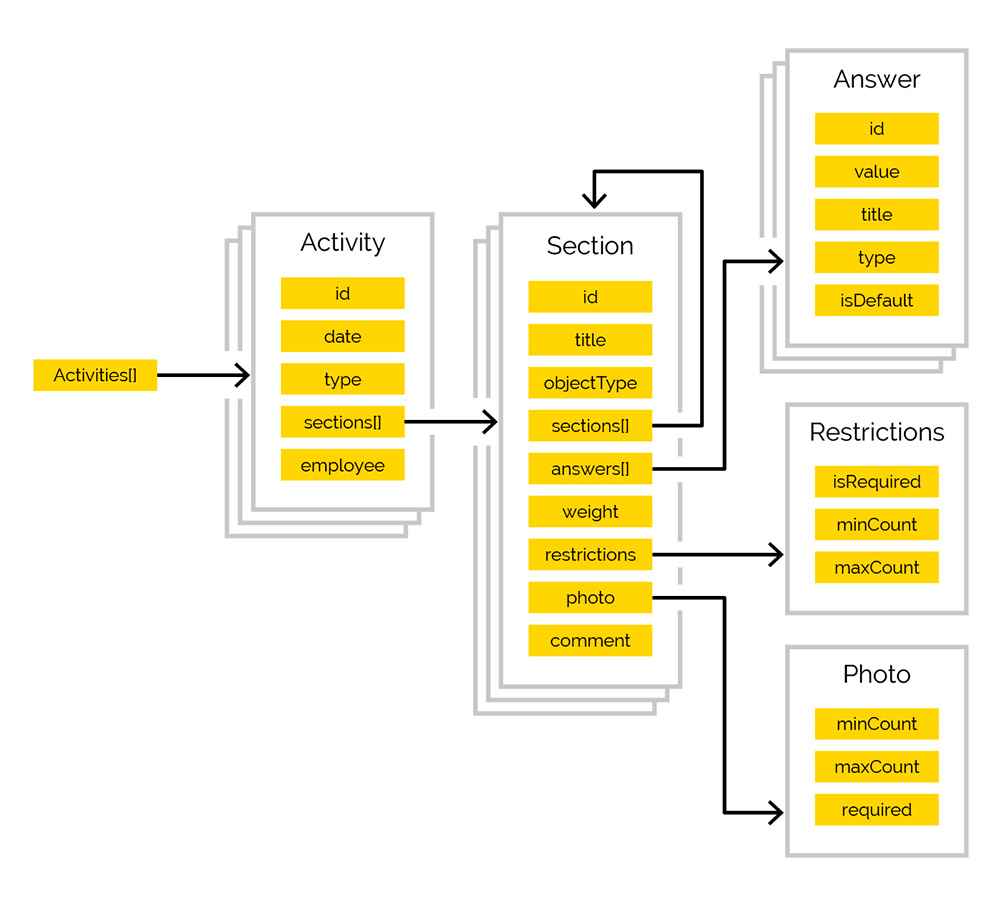
Activity: a user-created meeting.
Section: an element rendered in the mobile app UI depending on the type of it (objectType property). For example, it might just be a named group or some control element. The section references the list of nested sections, i.e. section nesting is not limited.
The screenshot below shows how activities are displayed in the mobile app on the iPad. Section 1 has nested sections (2) as questions and they have different objectTypes.
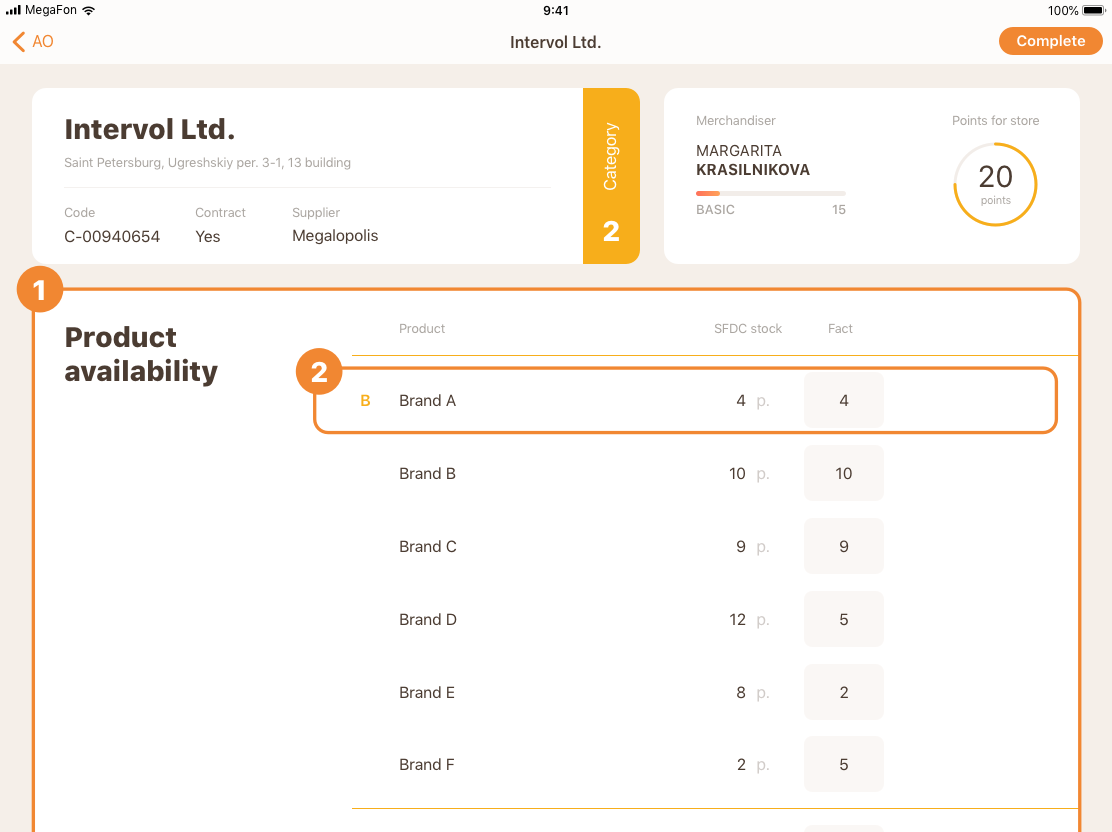
Thus, we can flexibly customize the template and structure of our worksheets without re-releasing the mobile app.
Support and filling out the worksheet
The main screen of the mobile application displays information about the employee along with their level of competence in addition to a set of worksheets to be filled out as part of the support or auditing:
- Preparation for field training is filled out at the beginning of the day
- Worksheet templates are filled out at each outlet
- The work standards are completed at the end of the workday
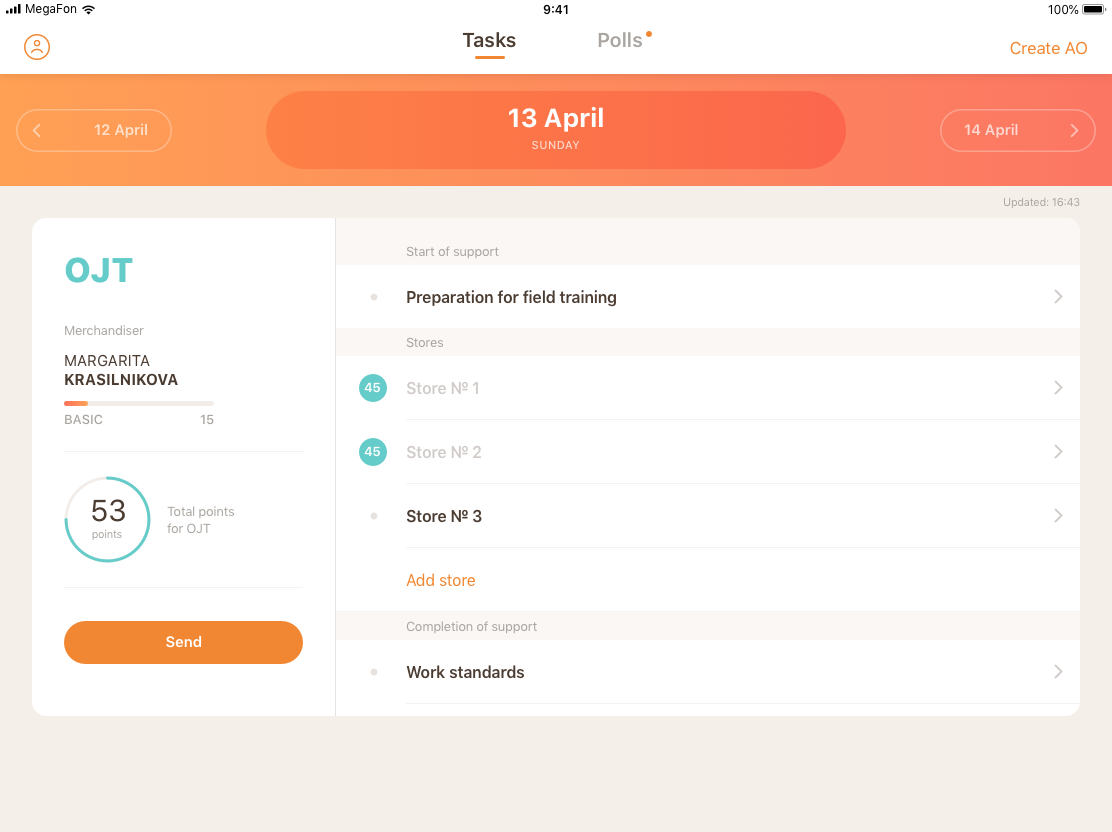
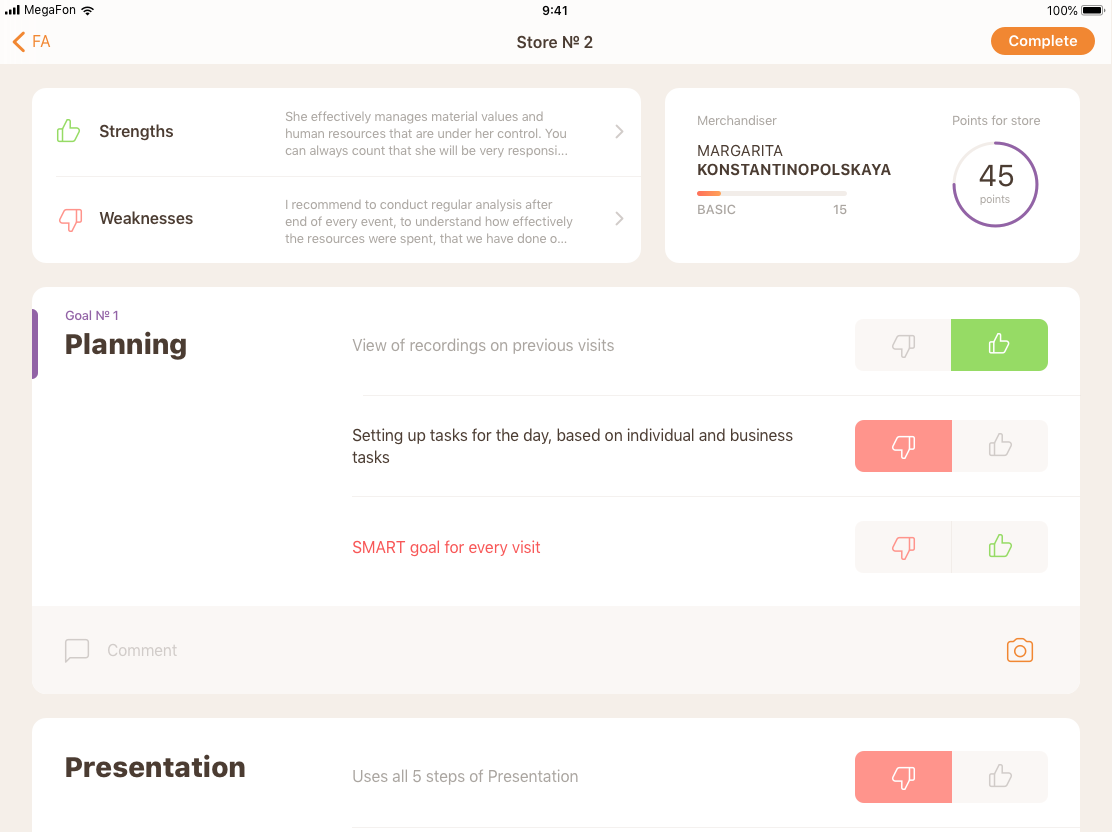
The supervisor accompanies the subordinate in an outlet, watching them as they do their work and filling the worksheet. On each worksheet we reflect a summary of the employee's strengths and weaknesses, enabling the supervisor to focus on developing specific skills. We also display a scale on which the results of the current monitoring session are placed, so that the supervisor can influence his subordinate in the here and now.
Throughout the support process, the supervisor makes comments on a group of questions and compiles a photo report to give comprehensive feedback at the end of the workday. Each worksheet has a block for strengths and weaknesses which is filled out throughout the course of the day and serves as a guide for further planning of the employee's development.
Sending the worksheet to the server
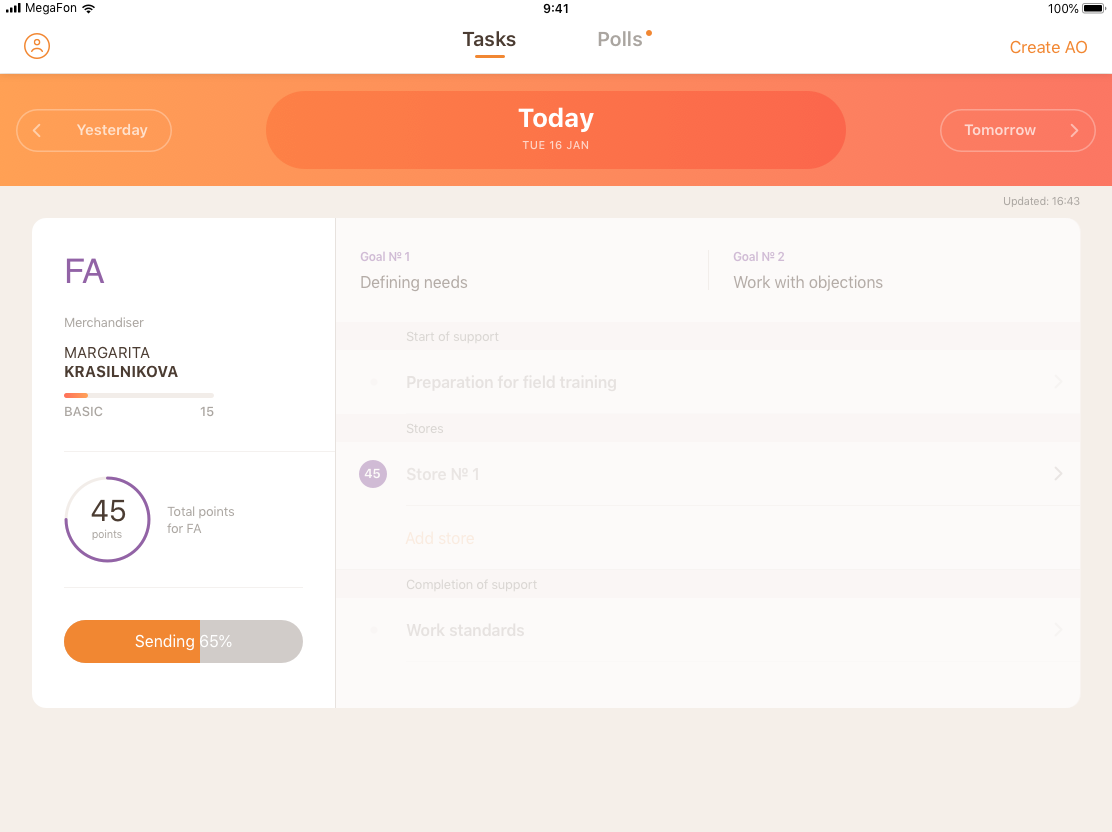
At the end of the day, the supervisor provides extended feedback to the merchandiser and sends the monitoring results to the portal. First, the underlying information on the complete worksheet is sent, then the photos are.
Results processing
The worksheets are sent to the server and displayed on the web portal, and the structure of them resembles templates. Data is also stored in a universal form separate from other components. Thus, we achieved independence from the worksheet structure being changed even in the reports.
These results allow the manager to compile reports with different performance statistics: on the entire team as well as on each employee.
- You have information as to how many meetings of what type have been created throughout the course of a month and how many of them actually have taken place
- You can obtain a report on the subordinates’ competencies (it is a point system, so you can see the dynamics represented)
- You can analyze the dynamics of the entire team. And if necessary, you can see the detailed results of particular maintenance or audit, along with answers to questions, comments, photo reports, and other notes to understand the reasons for the changes that have occurred
- There are nationwide statistics as well as statistics for each specific region
You can save the report as a PDF or Excel file. SQL Server Reporting Services are used for compiling reports. In fact, the reports were not that easy and since we aimed to maintain continuity of the design and style, there were so details regarded the work that had to be performed that they were enough for a whole separate article. We promise that in the near future we will write a detailed article about the solutions we used.
The results
The solution took employee training, certification, competence, and skill analysis to a whole new level of quality. It has been in operation for just over 10 months and over the time that has passed, more than 3,700 maintenances and audits have already been carried out.
The iPad app replaced paper worksheets all the while greatly increasing the speed of input and efficiency of supervisors. Now they have more time for observation, training, and providing detailed feedback.
The portal section allows you to view reports in a single click, upload dynamics for employees, the team, and each type of activity. In the report, you can see the completed worksheet and details of each meeting with each employee. You can understand the causes of changes that occurred as well as view photo reports and comments. Furthermore, you can plan the team’s further development based on a number of factors and complex analytics.
Further development
The system’s architecture has great scaling and development potential. In the future, the solution can easily be expanded with functions for collecting additional information for marketing purposes (for example, for analyzing brand exposure in a window based on our data science solutions for product identification in a window photo), logistics purposes, merchandise, and the company’s HR departments. And thus, once again, it will be able to improve the quality of the work that all the stakeholders do.